This map is based on the data of patients admitted to the following hospital and represent the cases till 30 March 2020:
Bahria Hospital,
Childern Hospital
Ganga Ram Hospital
General Hospital
Jinnah Hospital
Mayo Hospital
National Hospital
PKLI Hospital
Services Hospital
Shahdara Teaching Hospital
Sheikh Zaid Hospital
Social Security Hospital
Tag Archives: Lahore
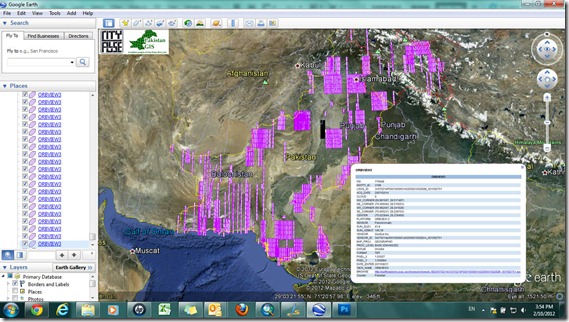
OrbView-3 High Resolution Images of Pakistan for Free
OrbView-3 high resolution imagery of Pakistan is now available in public domain since January 9, 2012. The images in this catalogue have been acquired between 2003 to 2007 and include more than 2400 scenes with the resolution of 1 meter (pan) and 4 meters (multispectral) of different place in Pakistan. Map below shows coverage of the available images. One can access it via USGS’s EarthExplorer as well.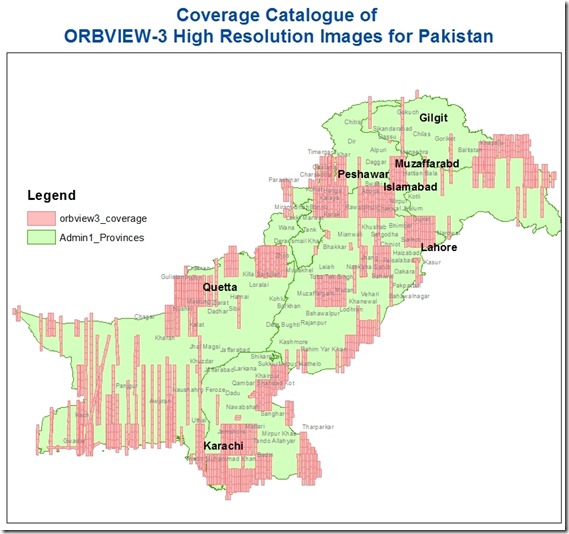
Download KML file of the Coverage:
An analysis of mapping potential from OrbView 3 Images is given below (extracted from GIM International)
Information Content of High-resolution Satellite Image
The information content of OrbView-3 and Ikonos imagery is compared, using the Zonguldak area in Turkey as test area. Although OrbView-3 images are qualitatively slightly inferior to Ikonos panchromatic scenes, they can be used for the generation of topographic maps at scale 1:10,000. However, they are not suited for 1:5,000 mapping, for which scale Ikonos images also show limitations.
In operation since 2004, OrbView-3 is one of the recent very high-resolution space sensors, offering images of 1m panchromatic and 4m multispectral Ground Sampling Distance (GSD). In mapping terms both geometric accur-acy and information content are important, but the required geometric accuracy can be reached without difficulty provided that images are not degraded by at-mosphere and sun-elevation effects. As a rule of thumb, the GSD should be at least 0.1mm of the map scale, corresponding to scale 1:10,000 for 1m GSD.
Visual Comparison
Examination of information content has to be done by visual inspection (Figure 1). OrbView-3 and Ikonos have approximately the same resolution, but comparison shows that edges are sharper in the Ikonos image and that whilst OrbView-3 shows cars only as blobs, structural elements are visible in Ikonos. The GSD of 0.62m offered by QuickBird enables identification of more detail. On the other hand, the 5m GSD of Spot 5 limits the use of these images to the creation of maps of smaller scale. Buildings are still visible but they cannot be mapped in detail, and sometimes back-gardens will be identified as streets. Many of these differences result from sensor configuration, radiometric resolution, recording conditions and terrain characteristics.
Sensor Configuration
OrbView-3 uses staggered CCD-lines; two CCD-lines are shifted by 0.5 pixels against each other so that the pixel size projected on the ground for nadir view is 2m and adjacent pixels overlap 50% in both directions (Figure 2). The effective GSD of 1m resulting from such over-sampled pixels differs from nominal GSD of 1m. OrbView-3 takes 2,500 double lines per second, but the satellite footprint speed is 7.1km/sec, which requires permanent change of view direction to slow down angular speed. The resulting slowdown factor is 1.4 (Figure 3). The effective GSD as determined by point-spread analysis of sharp edges does not show loss of resolution against the nominal GSD, but it can be manipulated by contrast enhancement.
Radiometric Resolution
OrbView-3, Ikonos and QuickBird have a radiometric resolution of 11bit, with which 2,048 grey valu-es can be represented. However, the grey values within one scene will not cover the whole range and a qualified change from 11bit to 8bit grey values does not lead to significant loss of information. Only in some crucial areas do differences appear between the original 11bit and the derived 8bit grey values. Figure 4 shows more details in the roof in the original 11bit image than in its 8bit counterpart. This may be important for automatic image matching, but for mapping purposes it is unimportant because in both cases the building can be sufficiently well identified in all required detail.
Recording Conditions
Haze, clouds and smoke may reduce contrast; enhancement is possible but the resulting image quality will not approach that of images taken under optimal conditions. Sun elevation and azimuth cause shadows that hinder identification of details (Figure 5). With a sun elevation angle of 63°, shadows in the OrbView-3 image are not so long as in the Ikonos image with a sun elevation angle of 41°. Shadows cause identification problems in scenes with narrow streets, high buildings and terrain inclination, as is the case in the north of the Zonguldak area, but sometimes shadows may support object identification. For example, a helicopter landing-pad might at first sight look like a roof, but missing shadow may indicate that it is on the same level as surrounding grassland.
Terrain Characteristics
Contrast is the dominant component of image interpretation, but identification of objects also depends on their characteristics. Planned areas, with larger, well-arranged buildings can be more easily mapped than unplanned areas with smaller and irregu-lar objects, especially when the latter occur in hilly terrain (Figure 6). Identification of objects in planned areas does not result in significant differences between OrbView-3 and Ikonos panchromatic images, while in unplanned areas the better image quality of Ikonos resulted in a larger number of identified objects. Not every building has a rectangular shape and, particularly in hilly terrain, walls may not be parallel. Figure 7 shows a building of irregular shape (a), a rectangular building (c) and a low building throwing little shadow (b). The latter has not been identified during the mapping exercise, mainly because of missing shadow. OrbView-3 cannot take panchromatic and colour images simultaneously as do Ikonos and QuickBird, so no direct pan-sharpening was possible. Mapping with pan-sharpened Ikonos and QuickBird images simplified object identification, but this does not mean that more objects can be identified; the number was insignificant.
Results
Table 1 summarises the detection (DET) and recognition (REC) possibilities of features and objects in OrbView-3 and Ikonos imagery. Figure 8 shows maps created from panchromatic OrbView-3 and Ikonos images. All buildings and nearly all roads have been recognised in the Ikonos image; a few roads in shadowy areas have not been recognised. In the OrbView-3 mapping 93% of the buildings and 96% of the roads mapped with Ikonos are seen, while only 33% of the pavements could be identified. These results demonstrate that OrbView-3 images are well suited for creation of 1:10,000 topographic maps.
Biography of the Author(s)
Huseyin Topan is a PhD candidate for geodesy and photogrammetry in the Ýstanbul Technical University, Turkey. His main research direction is the infor-mation content and geometry of high-resolution space imagery.
Gürcan Büyüksalih is professor in Photogrammetry at Zonguldak Karaelmas University, Turkey. He received his PhD from the University of Glasgow, UK, Department of Geography and Topographic Science. His research direction is the full range of photogrammetry, especially application of space imagery.
Karsten Jacobsen received a PhD in Photogrammetry from Leibniz University, Hanover, Germany. He is academic director of the Institute of Photogrammetry and Geo-information at the same university. His main research area is numerical photogrammetry, especially the use of space imagery.
Vector Datasets (ESRI Shapefiles)
Currently following vector datasets are available in ESRI Shape files Format at this blog:
Administrative Boundaries Maps:
- National and Provincial Boundaries of Pakistan (Admin Level 0 and 1)
- District Boundaries of Pakistan (Admin Level 2)
- Tehsil Boundaries of Pakistan (Admin Level 3)
- Union Council Map (Admin level 4) of District Barkhan – Balochistan
-
Union Council Map (Admin level 4) of District Jaffarabad – Balochistan
-
Union Council Map (Admin level 4) of District Killa Saifullah – Balochistan
-
Union Council Map (Admin level 4) of District Kohlu – Balochistan
-
Union Council Map (Admin level 4) of District Loralai – Balochistan
-
Union Council Map (Admin level 4) of District Nasirabad – Balochistan
-
Union Council Map (Admin level 4) of District Sibi – Balochistan
Khyber Pakhtunkhwa
-
Union Council Map (Admin level 4) of District Abbottabad – KPK
-
Union Council Map (Admin level 4) of District Bannu – KPK
-
Union Council Map (Admin level 4) of District Batagram – KPK
-
Union Council Map (Admin level 4) of District Buner – KPK
-
Union Council Map (Admin level 4) of District Charsadda – KPK
-
Union Council Map (Admin level 4) of District Chitral – KPK
-
Union Council Map (Admin level 4) of District Dera Ismail Khan – KPK
-
Union Council Map (Admin level 4) of District Hangu – KPK
-
Union Council Map (Admin level 4) of District Haripur – KPK
-
Union Council Map (Admin level 4) of District Karak – KPK
-
Union Council Map (Admin level 4) of District Kohat – KPK
-
Union Council Map (Admin level 4) of District Kohistan – KPK
-
Union Council Map (Admin level 4) of District Lakki Marwat – KPK
-
Union Council Map (Admin level 4) of District Lower Dir – KPK
-
Union Council Map (Admin level 4) of District Malakand P.a. – KPK
-
Union Council Map (Admin level 4) of District Mansehra – KPK
-
Union Council Map (Admin level 4) of District Mardan – KPK
-
Union Council Map (Admin level 4) of District Nowshera – KPK
-
Union Council Map (Admin level 4) of District Peshawar – KPK
-
Union Council Map (Admin level 4) of District Shangla – KPK
-
Union Council Map (Admin level 4) of District Swabi – KPK
-
Union Council Map (Admin level 4) of District Swat – KPK
-
Union Council Map (Admin level 4) of District Tank – KPK
-
Union Council Map (Admin level 4) of District Upper Dir – KPK
Punjab
-
Union Council Map (Admin level 4) of District Bahawalpur – Punjab
-
Union Council Map (Admin level 4) of District Bhakkar – Punjab
-
Union Council Map (Admin level 4) of District Dera Ghazi Khan – Punjab
-
Union Council Map (Admin level 4) of District Jhang – Punjab
-
Union Council Map (Admin level 4) of District Khushab – Punjab
-
Union Council Map (Admin level 4) of District Layyah – Punjab
-
Union Council Map (Admin level 4) of District Mianwali – Punjab
-
Union Council Map (Admin level 4) of District Multan – Punjab
-
Union Council Map (Admin level 4) of District Muzaffargarh – Punjab
-
Union Council Map (Admin level 4) of District Rahim Yar Khan – Punjab
-
Union Council Map (Admin level 4) of District Rajanpur – Punjab
Sindh
-
Union Council Map (Admin level 4) of District Dadu – Sindh
-
Union Council Map (Admin level 4) of District Ghotki – Sindh
-
Union Council Map (Admin level 4) of District Hyderabad – Sindh
-
Union Council Map (Admin level 4) of District Jacobabad – Sindh
-
Union Council Map (Admin level 4) of District Jamshoro – Sindh
-
Union Council Map (Admin level 4) of District Kashmore – Sindh
-
Union Council Map (Admin level 4) of District Khairpur – Sindh
-
Union Council Map (Admin level 4) of District Larkana – Sindh
-
Union Council Map (Admin level 4) of District Matiari – Sindh
-
Union Council Map (Admin level 4) of District Naushahro Feroze – Sindh
-
Union Council Map (Admin level 4) of District Qambar Shahdadkot – Sindh
-
Union Council Map (Admin level 4) of District Shaheed Benazirabad – Sindh
-
Union Council Map (Admin level 4) of District Shikarpur – Sindh
-
Union Council Map (Admin level 4) of District Sukkur – Sindh
-
Union Council Map (Admin level 4) of District Tando Muhammad Khan – Sindh
-
Union Council Map (Admin level 4) of District Thatta – Sindh
Urban Union Councils:
Urban Area Maps:
-
Haripur GIS Map (ESRI Format)
-
Peshawar GIS Map (ESRI Format)
-
Mianwali Tehsil GIS Map (ESRI Format)
-
Quetta GIS Map (ESRI Format)
-
Gilgit GIS Map (ESRI Format)
-
Nankana Sahib GIS Map (ESRI Format)
-
Jaranwala GIS Map (ESRI Format)
-
Pindi Bhattian GIS Map (ESRI Format)
-
Khangah Dogran GIS Map (ESRI Format)
-
Chiniot GIS Map (ESRI Format)
-
Chakwal GIS Map (ESRI Format)
-
Attock GIS based Land use Map (ESRI Format)
-
Faisalabad GIS based Land use Map (ESRI Format)
-
Village Kesar Garh (District Kasur) GIS Based Landuse Map (ESRI Format)
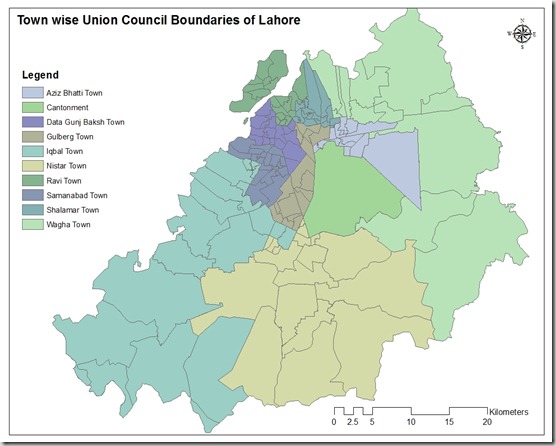
Town wise Union Council Boundaries of Lahore
This GIS map consists of polygonal boundaries for 151 union councils of Lahore urban area divided in 11 Towns.
Special thank to our very Valued Contributor for Lahore.
.::Click HERE to request for this data set::.
GIS Jobs in Urban Unit Lahore (2011)
Dear All,
The Urban Unit, Lahore is looking for high quality, GIS professionals, including Developers, Web developers, hardware support and digitizers.
If any of you is interested or know someone else who is suitable for the work, please encourage them to e-mail their CVs directly to the Project Director UU (nasir_dsp@yahoo.com) as early as possible.
Note: This information has been shared by Nizam ud Din at our facebook page HERE.
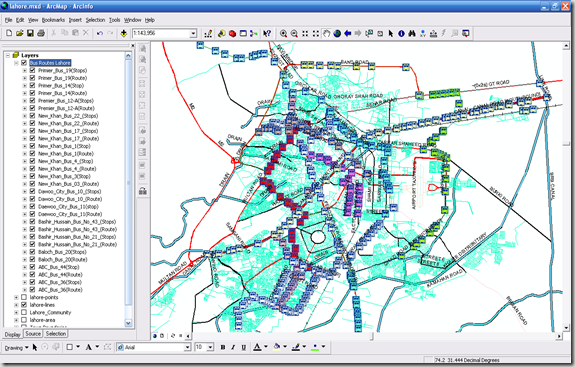
GIS Map of Bus Routes in Lahore
Mirza Muhammad Waqar form University of the Punjab is working on a project related to GIS mapping of various public transport routes in Lahore. He has generously shared his field data collected through primary surveys using GPS device. It includes the Bus Route Lines and Bus Stops Locations.
The GIS layers include the following routes:
- ABC Bus Route 36 (Chungi Amar Sadu to Daroghawala)
- ABC Bus Route 44 (Daroghawala to Old Ravi Pull)
- Baloch Bus Service Route 20 (Old Ravi Pull to Bagrian)
- Bashir Hussain Bus Route 21
- Bashir Hussain Bus Route 43
- Daewoo City Bus Route 11 (Green Town to Station)
- Green City Bus Route 10 (Railway Station to NFC Housing Scheme)
- New Khan Bus Route 3
- New Khan Bus Route 4
- New Khan Bus Route 1 (Sanda to RZ Bazar)
- New Khan Bus Route 17 (Railway Station to Jallo Pind)
- New Khan Bus Route 22 (Jallo Mor to Thokar Niaz Beig)
- Premier Bus Route 12-A (Railway Station to Yohanabad)
- Premier Bus Route 14 (RA Bazar to Bagrian)
- Premier Bus Route 19
Availability:
Data is available in ESRI Shape file formats.
Get Data:
GIS Map of Lahore (ESRI format)
PKMAPS is a small community of mapping enthusiasts (all over the world) choosing to map Pakistan and share data for free on the internet. They develop maps for GPS or navigators for providing aid in navigation across the Pakistan.
Here, we are using their gps maps to prepare ESRI format shape files, that can be used in GIS software like ArcGIS and Arcview for various analysis and applications for urban planning. Hence expanding the area of application for those maps.
We are presenting a map of Lahore city containing line, point and polygonal features. Coverage and Road hierarchy is visible even from the picture below.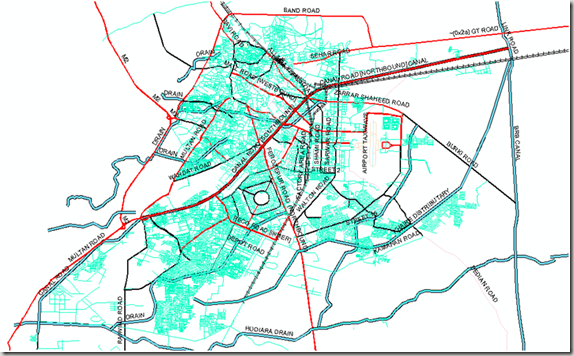
Points Shape File:
About 1082 places of interest are identified and categories as Hospitals, banks, graveyards, libraries, parks, schools, restaurants, shopping centers, stadiums, amusement centers, landmarks and swimming areas etc.
Lines Shape File:
This layer includes 8418 line features which represent arterial roads, collector roads, residential streets, major highways, alleys, railway routes, airport runways, and water streams. 643 features are identified with their names as well.
Polygones Shape File:
This map layer carries 754 polygones showing city parks, lakes, orchards or plantations, housing schemes or institution boundaries and other polygonal features.Location names are updated for 690 features.
Screen shot below shows a zoom in view where all points, lines and polygonal features can be seen with the level of detail. 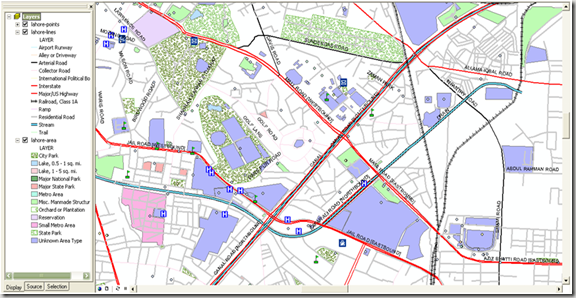
.::Special thanks to PKMAPS, smkhan and Faisal::.

