Google Earth Pro is now Free of Cost

From 30th Jan 2015, Google Earth Pro has been made available for free, earlier it was $400 per year. In order to get a free license key you may click here and download Earth Pro today. As compared to the normal free version, it allows the following additional functions:

  • Advanced Measurements: Measure land with polygon area measure, or determine affected radius with circle measure.
  • High-resolution printing: Print Images up to 4800×3200 px resolution.
  • Exclusive Pro data layers: Demographics, parcels, and traffic count for US only
  • Spreadsheet Import: Import up to 2500 addresses at a time, assigning placemarks and style templates in bulk.
  • GIS import: Visualize ESRI shapefiles (.shp) and MapInfo (.tab) files.
  • Movie-Maker: Export Windows Media and Quicktime HD movies, up to 1920×1080 resolution.

A comparative analysis of Free and Pro functions is given below:

image

Understanding Geographic Information Systems (5th Training Course)

PakistanGIS is offering GIS training courses for beginners interested in learning concepts and applications of GIS in different spheres of life. “Understanding Geographic Information Systems” is an introductory training being organized for students and professionals who stand at primary level in the field of GIS and want to enhance their learning about the subject.

This course is a perfect mix of theoretical and practical sessions particularly designed for people who are looking for their capacity enhancement in evening time in Islamabad.

Contact Details: naeem.malik@pakistangis.org
0334 65 69 580
0313 86 12 758
Venue:
Office 1&2, First Floor, G15 Markaz, Islamabad, Pakistan 
Dates and Timings:
20-24 October 2014
Timings will be updated.
Registration Fee:
Rs. 7000 PKR
See Training Schedule>>  

At the end of training you will be having knowledge about:

  1. Basic concepts and applications of GIS
  2. Components and functions of GIS
  3. Vector and Raster Data sets
  4. What are different softwares commonly used in the field of GIS?
  5. How to install ArcGIS?
  6. Getting started with ArcGIS, ArcCataloge, ArcMap and ArcToolbox
  7. How to prepare map using existing GIS data?
  8. How to create your own GIS data?
  9. Preparing print ready map layouts and maps printing

Website launched on Mobile based Data Collection

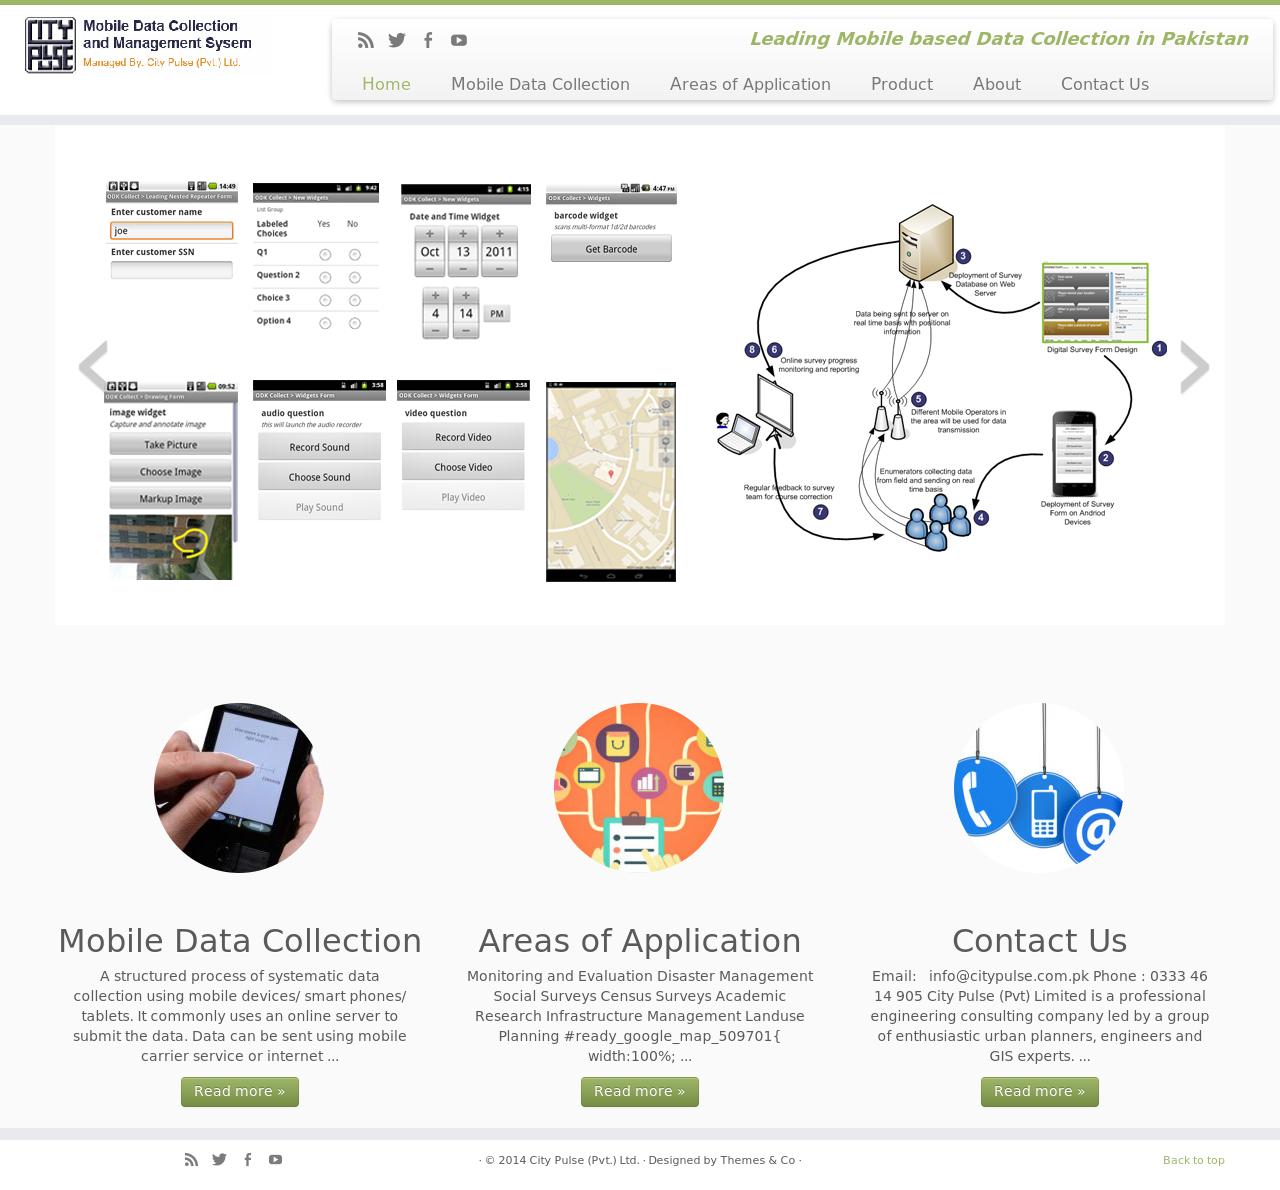
City Pulse (Pvt) Ltd. has launched the very first website containing very informative resource materials on Mobile based Data Collection and Management in Pakistan. Currently it presents background information on traditional vs mobile based data collection and benefits of mobile based data collection, its areas of application and conceptual stages in designing mobile based data collection and management system. More is expected to come soon.
mobile_Data_collection_pakistan

Using ODK Briefcase to fetch data from Aggregate Server

This tutorial has been written during the implementation of a mobile based data collection and management project in Charsadda, Pakistan.

ODK Briefcase is an integral part of mobile based data collection and management system. We have been using this simple but very useful tool to push and pull the collected data for our aggregate servers (a web based server holding data being sent from mobiles). ODK Briefcase can also be used to fetch data from ODK Collect when you are offline.

ODK Briefcase can be used for:

1. Export forms with submissions from ODK Aggregate – PULL

2. Make bulk submission to ODK Aggregate – PUSH

3. CSV exports of submission data

4. Pull forms and submissions collected by ODK Collect from a mobile phone

Use ODK Briefcase to fetch data from server:

1. Install Java 6 or higher on your computer.

2. Download ODK briefcase from http://code.google.com/p/opendatakit/ and open it.

3. Specify the location of the ODK storage area on your computer this will create the ODK Briefcase Storage folder which will hold all the blank forms and finalized forms. For example, we kept it to H:\CharsaddaData. It will automatically create a subfolder named ‘ODK Briefcase Storage’ there

image

4. On the tab “Pull,” click on the bar to the right of “Pull data from:” (top left) and choose “Aggregate 1.0”.

5. Click on “Connect” to pull data from aggregate 

image

6. Specify the server url, enter the username and password to the server account. Click “Connect” to pull forms from server. In this case server address will be https://citypulsedata.appspot.com

image

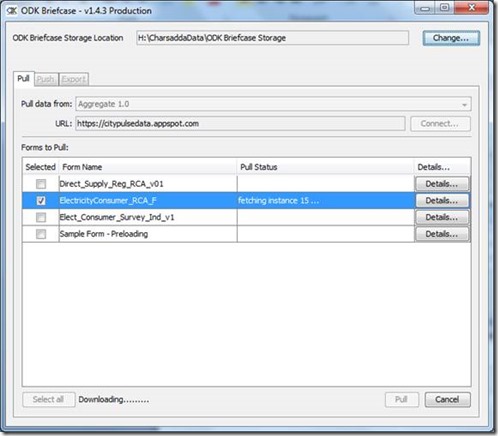
7. In the main screen, find the form you want to download and tick off on the check box to the left of it. In Charsadda project case, you need to select ElectricityConsumer_RCA_F.

image

8. Hit “Pull” button at bottom right of page. It will start fetching the form and you will be able to see the progress. ODK Briefcase automatically see if any form is already downloaded in the given folder. In that case it will quickly go through those form and will fetch only the new records.

clip_image015

9. Wait until you see the “SUCCESS!” message on the “Pull status”. 

image

Using ODK Briefcase to export data in csv format:

1. Go to “Export” tab. Pull down the bar to the right of “Form:” (top left) and choose the relevant form. In case of our example it will be ElectricityConsumer_RCA_F

image

2. Click on the “Choose” button to select the export directory. For example in current case its same H:\CharsaddaData

image

3. Click “Export” button on the bottom-most right of the application. This will load quickly and will give you the same “SUCCESS!” message.

4. Go to the directory where you placed the data (e.g. H:\CharsaddaData) and you will find a folder title media along with a csv file titled same as the form (e.g. ElectricityConsumer_RCA_F.csv). Use this csv file along with media folder for any further operations if necessary.

Mobile Data Collection with Preloaded data

Background:

Recently I was asked to design a mobile based data collection and management system to collect data of sugarcane growers in Pakistan. The objective was to develop a data collection and management system which can be used to collect data from sugar cane growers using android based devices. The collected data required to contain text, numeric and pictures along with geographic shapes (polygons) of the sugarcane fields.

The field enumerators were expected to have low education level so it was desired to make the mobile data collection as intuitive and user friendly as possible. The weather and field conditions were tough requiring considerations.

The collected data was to be audited by supervisors through a web interface where they wanted to view and verify the collected data as well as the location, shape and size of sugarcane field. They wanted to view the polygon of sugarcane filed overlaid on satellite image with the ability to modify coordinates of polygon shape.

Additionally, it was required to have some mechanism in which existing data of sugarcane growers is made available on mobile data collection devices so that enumerator does not need to fill in all data fields. Instead they can simply verify if the existing data was correct.

Form Design with Preloaded data:

We decided to base our work on Open Data Kit with customized data collection forms and reporting server. ODK Collect 1.4.3 allows the data preloading in new round of survey. We took advantage of that and created a survey form with associated database of existing grower information. Some key technical aspects in designing such forms include the following:

  1. Create a .csv file containing the data you want to use as pre-loaded in your questions. For example our csv name is SCGDV1.csv
  2. The .csv file must contain a column with name ending with “_key”. This column will be used for lookup. For example in our case we used “grower_id_key”
  3. The column names for other columns should also be short and unique.
  4. Create a simple form using ODK build or any other xml form builder of your choice
  5. Open the xml for in note pad or any other xml editor for advance changes
  6. Search for  “<bind nodeset” and you will reach in the part of form containing data nodes
  7. Initially they will look like:
    <bind nodeset="/data/grower_id" type="int"/>

    <bind nodeset="/data/name" type="string" required="true()"/>

    <bind nodeset="/data/father_name" type="string"/>

    <bind nodeset="/data/nic" type="int" required="true()"/>

    <bind nodeset="/data/land" type="int"/>

    <bind nodeset="/data/location" type="geopoint"/>

  8. Add pulldata() function to desired nodesets where you want to have preloaded data.
  9. The syntax will be like
    calculate="pulldata('SCGDV1', 'name', 'grower_id_key',  /data/grower_id)"

    calculate=”pulldata(‘SCGDV1’, ‘name’, ‘grower_id_key’,  /data/grower_id)”

  10. Where SCGDV1 is name of csv file, “name” is the column heading whose value you want to pull against grower_id given in /data/grower_id while “grower_id_key” will be used for searching that name.
  11. Suppose you entered 15 as a grower_id in a question and you use pulldata() function to fetch name of the grower having id 15 from the csv file. So it will search for 15 in “grower_id_key” column and will find the corresponding name for that record and fill the Name question with what it found.
  12. pulldata() function is used with a calculate command with each nodeset and resultantly code looks like this
    <bind nodeset="/data/grower_id" type="int"/>

    <bind calculate="pulldata('SCGDV1', 'name', 'grower_id_key',  /data/grower_id)" nodeset="/data/name" type="string" required="true()"/>

    <bind calculate="pulldata('SCGDV1', 'father_name', 'grower_id_key',  /data/grower_id)" nodeset="/data/father_name" type="string"/>

    <bind calculate="number(pulldata('SCGDV1', 'nic', 'grower_id_key',  /data/grower_id))" nodeset="/data/nic" type="int" required="true()"/>

    <bind calculate="number(pulldata('SCGDV1', 'land', 'grower_id_key',  /data/grower_id))" nodeset="/data/land" type="int"/>

    <bind nodeset="/data/location" type="geopoint"/>

  13. Even when they are numbers, data fields pulled from a .csv file are considered to be text strings. Thus, you may sometimes need to use the int() or number() functions to convert a pre-loaded field into numeric form. In my case int() did not worked but number() works fine as it can be seen above. I had to use this function for each and every nodeset where data type was integer. Otherwise it gives error.
  14. Once form is complete, test is using ODK Validate and upload in your aggregate along with csv file. Deploy on your mobile and it works perfect.

Census of Schools with GIS Coordinates

  1. Punjab

It is lovely to see the Census of Schools conducted by Schools Education Department, Government of Punjab. The online database contains very comprehensive information for more than 55 thousand educational facilities in all districts of Punjab along with locational information.

image

Below image shows, how it looks like when plotted in GIS all together at once. Only a few schools (less than 3%) have got missing GIS coordinates or wrongly placed coordinates, but overall it’s a very comprehensive and rich piece of information for those interested in education sector in Punjab.

image

2.  Sindh

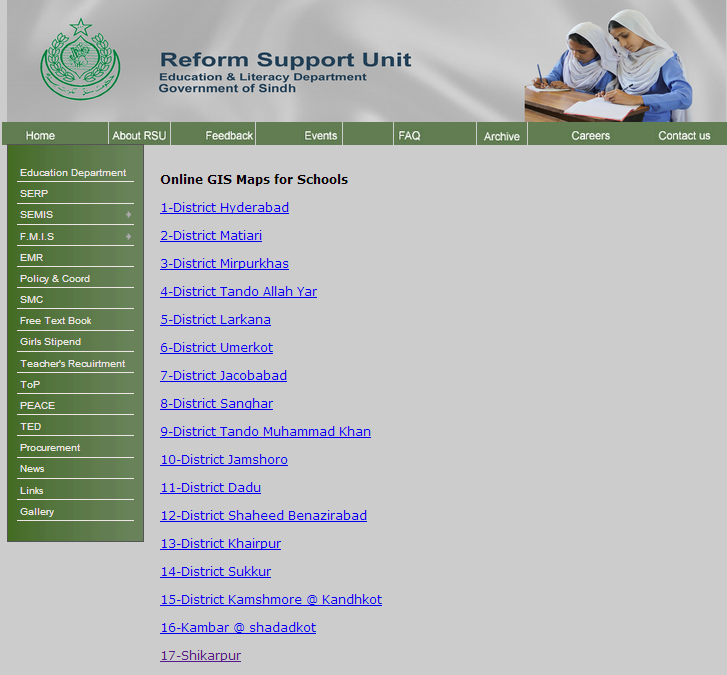
Reform Support Unit, Education and Literacy Department, Government of Sindh has also done a great job by providing online access to School Census Database and Online GIS coordinates of schools from 17 districts. So far, these districts include Hyderabad, Matiari, Mirpurkhas, Tando Allah Yar, Larkana, Umerkot, Jacobabad, Sanghar, Tando Muhammad Khan, Jamshoro, Dadu, and Shaheed Benazirabad, Khairpur, Sakkur, Kashmore, Shahdadkot and Shikarpur.

sindh_schools_gis_pakistan

Currently the online database contain coordinates of more than 28 Thousand as of July 2014 educational facilities spreaded over 17 districts. This is how it looks like all together.

image

Overall picture look like the image below:

image

Experiments with Google Map V3

Two months back, I was novice with absolutely zero experience of Google Maps API or JavaScript. Luckily or unluckily, I was put in the condition where I have to develop a WebGIS for visualization of datasets. I started hitting my head with the examples, samples and codes available online and was successful in preparing something acceptable to end users. Most of the time, I searched for relevant sample code on web, changed the parameters and adapted for my purpose in clean and more understandable form. I feel those pieces of codes might be helpful for other ‘forced to be developers’ like me. I will be sharing those JavaScripts and Google Map API v3 codes here regularly.

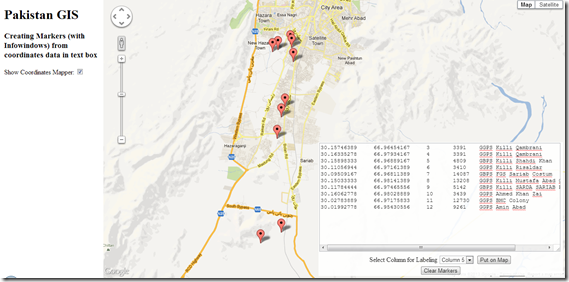
  1. Create Markers (with InfoWindows) from coordinates pasted in Text Box

I wrote this code in order to make user capable of copying data from Excel sheet and paste in text box to map it.

Once the data is copied from Excel, it comes as ‘TAB’ delimited text when pasted in box. The javascript code splits the data into lines, separates values in each line based on Tabs and then display the enteries as Markers on map using first two columns containing N, E respectively.

Specifying column number allows you to decide what to display in InfoWindow which displays while clicking on marker.

pakistangis

<!DOCTYPE html>

<html><head>

<meta name="viewport" content="initial-scale=1.0, user-scalable=yes" />

<script src="http://maps.googleapis.com/maps/api/js?v=3&sensor=false" type="text/javascript"></script>
   1:  

   2: <style type="text/css">

   3:   html { height: 100% }

   4:   body { height: 100%; margin: 0px; padding: 0px }

   5:   #map_canvas { height: 100% }

   6:   #textarea {

   7:     position:absolute;

   8:     padding:0px;

   9:     z-index:888;

  10:     bottom:5px;

  11:     right:5px;

  12:     opacity:0.90;

  13:     text-align:center;

  14:     border:0px #ccc solid;

  15:     background-color: #FFF;

  16:     visibility: hidden; 

  17:     }

  18: </style>

  19: <script type="text/javascript"> 

  20: var map;

  21: var points = [];

  22: var lines;

  23: function initialize() {

  24:  

  25:     map = new google.maps.Map(document.getElementById("map"), {

  26:         zoom: 5,

  27:         center: new google.maps.LatLng(30.637905104982618, 71.103515625),

  28:         mapTypeId: google.maps.MapTypeId.ROADMAP,

  29:         

  30:                 });

  31:             }

  32:  

  33: function createMarkers(coordinates){

  34:     lines = coordinates.split("\n");    //splits lines pasted in text box

  35:     alert('There are '+ lines.length +' points to display on map');

  36:     for (var i=0; i<lines.length; i++){

  37:         var xy = lines[i].split("\t");    //splits data in each line based on Tabs. Data copied from excel comes in Tab Delimited format

  38:         var x = xy[0];

  39:         var y = xy[1];    

  40:         var latlng =  new google.maps.LatLng(x,y);

  41:         points.push(latlng);

  42:         var marker = new google.maps.Marker({

  43:                 position: latlng,

  44:                 map:map

  45:         });

  46:         

  47:         var labelingColumn = document.getElementById('labelingColumn').value;

  48:         addInfoWindow(marker, xy[labelingColumn]);    // Third column in each line is passed to addInfoWindow as content for showing in infowindow

  49:       }

  50:       

  51:       zoomTo(points);

  52:   }

  53:   

  54:       function addInfoWindow(marker, content) {

  55:     var infoWindow = new google.maps.InfoWindow({

  56:         content: content

  57:     });

  58:  

  59:     google.maps.event.addListener(marker, 'click', function () {

  60:         infoWindow.open(map, marker);

  61:     });

  62:     }

  63:  

  64:     function zoomTo(points){

  65:     bounds = new google.maps.LatLngBounds();

  66:       for (i = 0; i < points.length; i++) {

  67:       bounds.extend(points[i]);

  68:       }

  69:       map.fitBounds(bounds);

  70:  

  71:     }

  72:     function clearMap(){

  73:         document.getElementById('coordinates').value = "";

  74:         initialize();

  75:         }

  76:     function showCoordinatesMapper(){

  77:         if(document.getElementById('csvToMap').checked){

  78:             document.getElementById('textarea').style.visibility = 'visible';

  79:             }

  80:         else {

  81:             document.getElementById('textarea').style.visibility = 'hidden';

  82:             }

  83:         }

</script>

</head>

<body onload="initialize()">

<!-- side panel div container -->

<div style="position:absolute; width:230px; height: 100%; overflow:auto; float:left; padding-left:10px; padding-right:10px;">

    <h1>Pakistan GIS</h1>

    <h3>Creating Markers (with Infowindows) from coordinates data in text box</h3>

    Show Coordinates Mapper: <input id="csvToMap" type="checkbox" onclick="showCoordinatesMapper();" />

</div>

<div id='textarea'>

  <form action="#" onsubmit="createMarkers(this.coordinates.value); return false">

    <textarea cols="40" rows="15" wrap="off" id="coordinates">Paste your data with coordinates here...</textarea>    

    </br>

    <label>Select Column for Labeling</label>

    <select id="labelingColumn" width = "100px">

          <option value="2">Column 3</option>

          <option value="3">Column 4</option>

          <option value="4">Column 5</option>

          <option value="5">Column 6</option>

      </select>


    <input type="submit" value="Put on Map"/>

    </form>

    <button id="delete-button" onClick="clearMap();">Clear Markers</button>

</div>

<!-- map div container -->

  <div id="map" style="height:100%; margin-left:250px;"></div>

</body>

</html>
Surveying and Mapping Act 2013

In a recent GIS Working Group meeting in Lahore, it has been shared by Major (Retd.) Nadeem Ahmad Ch. Director, Survey of Pakistan that the bill has been approved by Standing Committee on Defence of National Assembly but due to paucity of time the bill could not be presented in National Assembly for passing. However, now the same has been initiated in shape Presidential Ordinance which is in process of approval by federal government. The copy of Surveying and Mapping 2013 is posted on the website of National Assembly which can be downloaded.

FloodInfo.pk : An online Flood Risk Estimator in Pakistan

FRE

Flood Risk Estimator has been developed to support rural communities, government agencies, non-government organization and other line actors working in flood prone areas of District Layyah by providing them scenario based precise information on flood risks.

It is one of the outputs of a project titled ‘Enhancing capacities of flood prone communities through GIS based early warning system’ implemented by Doaba Foundation with technical support of City Pulse (Pvt.) Ltd. It has been generously supported by Oxfam GB.

Flood Risk Estimator has its core based on GIS based flood plain modeling and mapping techniques coupled with indigenous knowledge of riverine communities. It has been developed with the objectives of creating a system which can help in:

  1. estimating flood water spread at a particular discharge
  2. finding depth of flood water at any location in flooded area
  3. estimating the affected elements* at any particular discharge

*villages, population, schools, health facilities, public buildings, livestock hospitals, bridges, culverts, sippers, embankments, roads

All information on elements at risk and communities’ capacities have been obtained through primary sources via field visit, community meeting and GPS survey. Flood plain modeling is based on high resolution satellite images, Digital Elevation Model and ground observations of discharges and water flow. All spatial and non spatial data have been processed using HECRAS and associated GIS technologies. See detailed presentation on development process here.

Flood risk estimation report

A snapshot of Flood Scenario Report generated for one Union council

Flood risk estimation report2

A snapshot of Flood Plain Mapping and Elements at Risk

Flyonfloodedarea

A snapshot of Fly on Flooded Area