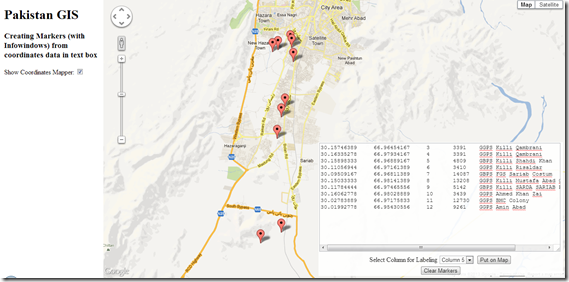
<script src="http://maps.googleapis.com/maps/api/js?v=3&sensor=false" type="text/javascript"></script>   1:

   2: <style type="text/css">

   3:   html { height: 100% }

   4:   body { height: 100%; margin: 0px; padding: 0px }

   5:   #map_canvas { height: 100% }

   6:   #textarea {

   7:     position:absolute;

   8:     padding:0px;

   9:     z-index:888;

  10:     bottom:5px;

  11:     right:5px;

  12:     opacity:0.90;

  13:     text-align:center;

  14:     border:0px #ccc solid;

  15:     background-color: #FFF;

  16:     visibility: hidden;

  17:     }

  18: </style>

  19: <script type="text/javascript">

  20: var map;

  21: var points = [];

  22: var lines;

  23: function initialize() {

  24:

  25:     map = new google.maps.Map(document.getElementById("map"), {

  26:         zoom: 5,

  27:         center: new google.maps.LatLng(30.637905104982618, 71.103515625),

  28:         mapTypeId: google.maps.MapTypeId.ROADMAP,

  29:

  30:                 });

  31:             }

  32:

  33: function createMarkers(coordinates){

  34:     lines = coordinates.split("\n");    //splits lines pasted in text box

  35:     alert('There are '+ lines.length +' points to display on map');

  36:     for (var i=0; i<lines.length; i++){

  37:         var xy = lines[i].split("\t");    //splits data in each line based on Tabs. Data copied from excel comes in Tab Delimited format

  38:         var x = xy[0];

  39:         var y = xy[1];

  40:         var latlng =  new google.maps.LatLng(x,y);

  41:         points.push(latlng);

  42:         var marker = new google.maps.Marker({

  43:                 position: latlng,

  44:                 map:map

  45:         });

  46:

  47:         var labelingColumn = document.getElementById('labelingColumn').value;

  48:         addInfoWindow(marker, xy[labelingColumn]);    // Third column in each line is passed to addInfoWindow as content for showing in infowindow

  49:       }

  50:

  51:       zoomTo(points);

  52:   }

  53:

  54:       function addInfoWindow(marker, content) {

  55:     var infoWindow = new google.maps.InfoWindow({

  56:         content: content

  57:     });

  58:

  59:     google.maps.event.addListener(marker, 'click', function () {

  60:         infoWindow.open(map, marker);

  61:     });

  62:     }

  63:

  64:     function zoomTo(points){

  65:     bounds = new google.maps.LatLngBounds();

  66:       for (i = 0; i < points.length; i++) {

  67:       bounds.extend(points[i]);

  68:       }

  69:       map.fitBounds(bounds);

  70:

  71:     }

  72:     function clearMap(){

  73:         document.getElementById('coordinates').value = "";

  74:         initialize();

  75:         }

  76:     function showCoordinatesMapper(){

  77:         if(document.getElementById('csvToMap').checked){

  78:             document.getElementById('textarea').style.visibility = 'visible';

  79:             }

  80:         else {

  81:             document.getElementById('textarea').style.visibility = 'hidden';

  82:             }

  83:         }
</script>
</head>

<body onload="initialize()">

<!-- side panel div container -->

<div style="position:absolute; width:230px; height: 100%; overflow:auto; float:left; padding-left:10px; padding-right:10px;">

    <h1>Pakistan GIS</h1>

    <h3>Creating Markers (with Infowindows) from coordinates data in text box</h3>

    Show Coordinates Mapper: <input id="csvToMap" type="checkbox" onclick="showCoordinatesMapper();" />

</div>

<div id='textarea'>

  <form action="#" onsubmit="createMarkers(this.coordinates.value); return false">

    <textarea cols="40" rows="15" wrap="off" id="coordinates">Paste your data with coordinates here...</textarea>

    </br>

    <label>Select Column for Labeling</label>

    <select id="labelingColumn" width = "100px">

          <option value="2">Column 3</option>

          <option value="3">Column 4</option>

          <option value="4">Column 5</option>

          <option value="5">Column 6</option>

      </select>


    <input type="submit" value="Put on Map"/>

    </form>

    <button id="delete-button" onClick="clearMap();">Clear Markers</button>

</div>

<!-- map div container -->

  <div id="map" style="height:100%; margin-left:250px;"></div>

</body>

</html>


