Tag Archives: Pakistan GIS Data
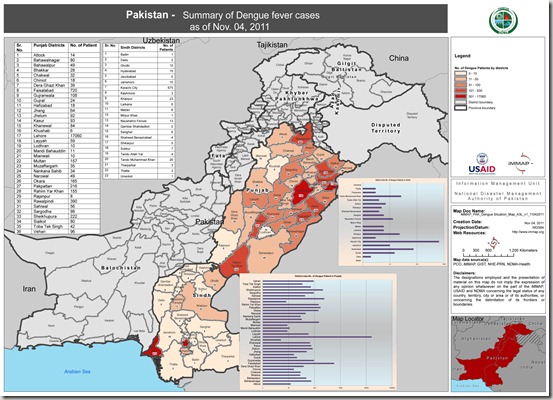
Situation Map of Dengue Fever Cases (04 Nov 2011)
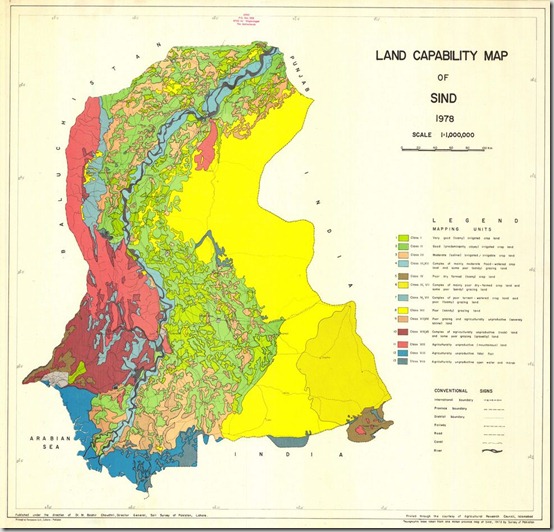
Land Capability Map of Sind
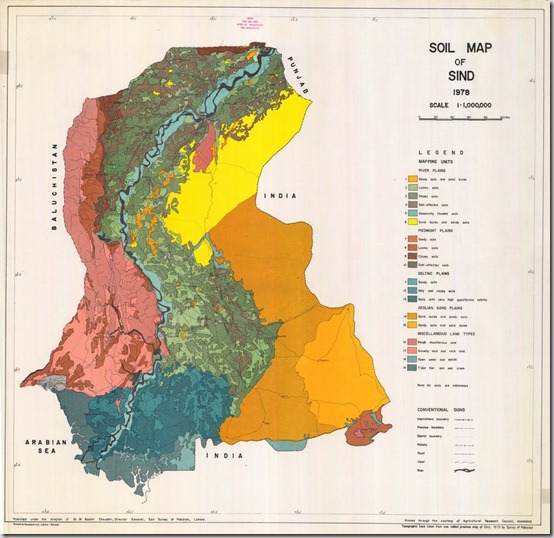
Soil Map of Sindh
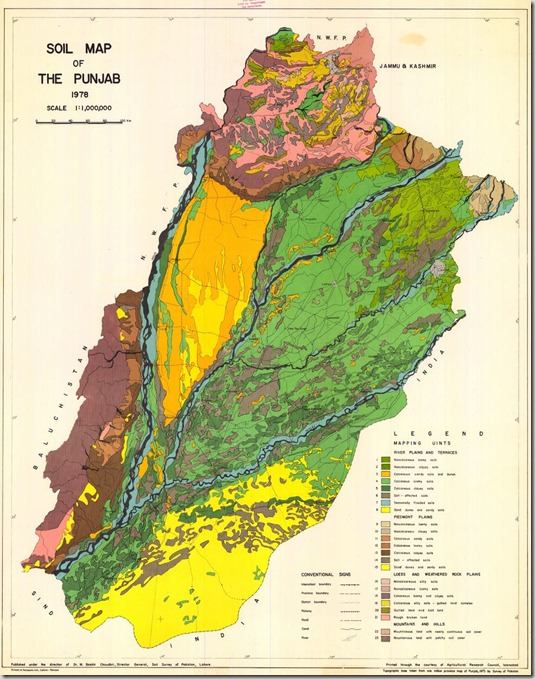
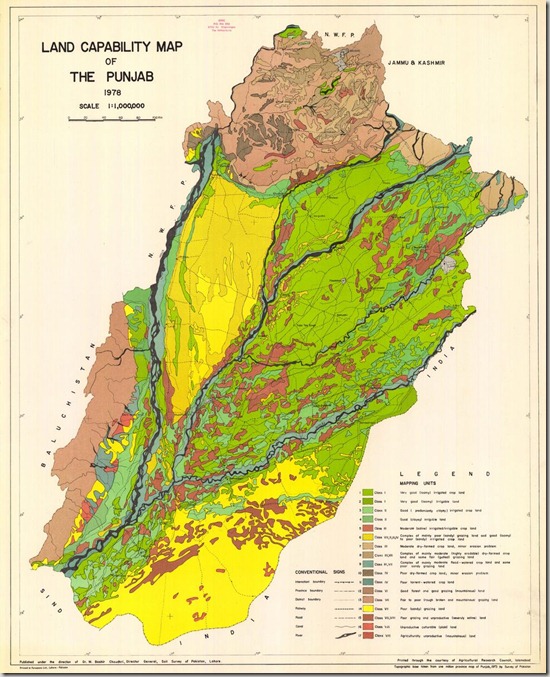
Soil Map of Punjab, Pakistan
Land Capability Map of Punjab
Karachi Town Administration Boundaries
This GIS map contains polygonal boundaries for 31 administration town of Karachi. It has been developed by Dr. Jamil H. Kazmi at he Department of geography, University of Karachi and generously shared by Bilal Aslam (Research Fellow).
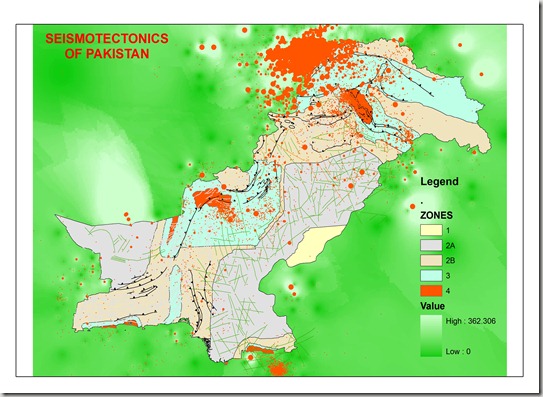
Seismo-Tectonic map of Pakistan
Seismo-Tectonic map of Pakistan having information for earth quack distribution, damages categories and major structural features with the background with interpolation on depth of the earthquakes.
This map has been developed and generously shared by Mohammad Ihsan Afridi, Geologist Pakistan Mineral Development Corporation, Peshawar Pakistan
Base data for this map have been collected from the meteorological department, some from the Engineering council as building design code of Pakistan and the rest have been digitized from the published map of the Geological Survey of Pakistan.
Raster Datasets
Following raster datasets are available for at this plate form:
- Digital Elevation Model Data of whole Pakistan (SRTM 90m)

- Digital Elevation Model Data of whole Pakistan (GASTER DEM 30m)
- Satellite Image of Pakistan Flood 13 September 2010
- Satellite Image of Pakistan Flood 07 September 2010
- Satellite Image of Pakistan Flood 02 September 2010
- Satellite Image of Pakistan Flood 29 August 2010
- Satellite Image of Pakistan Flood 22 August 2010
- Satellite Image of Pakistan Flood 17 August 2010
- Satellite Image of Pakistan Flood 15 August 2010
- Satellite Image of Pakistan Flood 12 August 2010
- Satellite Image of Pakistan Flood 11 August 2010
- Satellite Image of Pakistan Flood 10 August 2010
- Satellite Image of Pakistan Flood 08 August 2010
- Satellite Image of Pakistan Flood 30 July 2010
- Satellite Image of Pakistan Flood 28 August 2009
- Satellite Image of Pakistan Flood 14 August 2009
- Satellite Image of Pakistan Flood 11 August 2009
- Geo-referenced Topographic maps of Pakistan
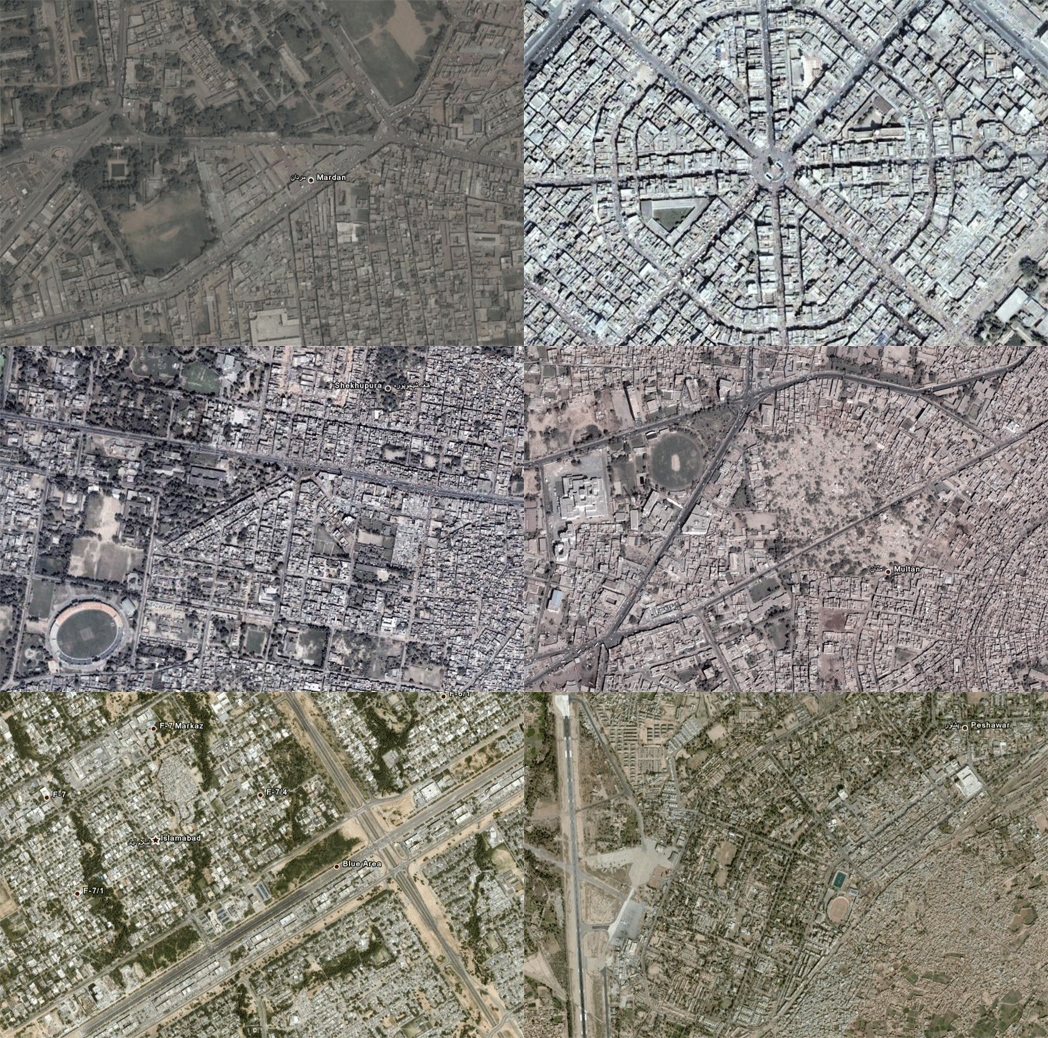
- Geo-referenced Satellite Image of Sialkot
- Satellite Map of Abbottabad City
- Satellite Image of Lahore City
- Satellite Image of Muredkey
- Satellite Image of Jhelum
- Satellite Image of Vehari
- Satellite Image of Liaqatput (Rahim yar Khan)
- Satellite Image of Faisalabad
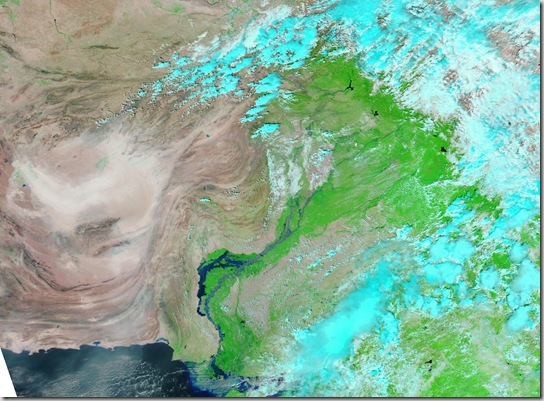
Satellite Image of Pakistan Flood 13 September 2010
Relying on NASA Earth Observatory on Natural Hazards, following image has been geo-referencing and converted to KML:
- 13 September 2010
The Moderate Resolution Imaging Spectroradiometer (MODIS) on NASA’s Aqua satellite captured this image of Pakistan. This image uses a combination of infrared and visible light to increase the contrast between water and land. Water appears in varying shades of blue, vegetation is green, and bare ground is pinkish brown. Clouds are bright turquoise.
.::Click HERE to request for this data set::.

