Experiments with Google Map V3

Two months back, I was novice with absolutely zero experience of Google Maps API or JavaScript. Luckily or unluckily, I was put in the condition where I have to develop a WebGIS for visualization of datasets. I started hitting my head with the examples, samples and codes available online and was successful in preparing something acceptable to end users. Most of the time, I searched for relevant sample code on web, changed the parameters and adapted for my purpose in clean and more understandable form. I feel those pieces of codes might be helpful for other ‘forced to be developers’ like me. I will be sharing those JavaScripts and Google Map API v3 codes here regularly.

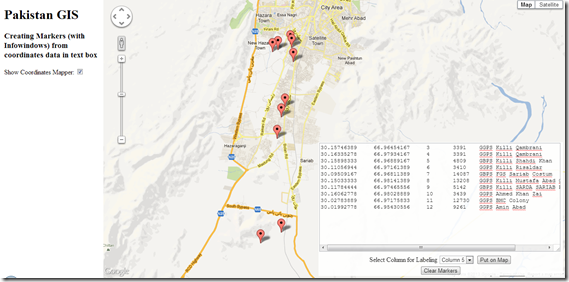
  1. Create Markers (with InfoWindows) from coordinates pasted in Text Box

I wrote this code in order to make user capable of copying data from Excel sheet and paste in text box to map it.

Once the data is copied from Excel, it comes as ‘TAB’ delimited text when pasted in box. The javascript code splits the data into lines, separates values in each line based on Tabs and then display the enteries as Markers on map using first two columns containing N, E respectively.

Specifying column number allows you to decide what to display in InfoWindow which displays while clicking on marker.

pakistangis

<!DOCTYPE html>

<html><head>

<meta name="viewport" content="initial-scale=1.0, user-scalable=yes" />

<script src="http://maps.googleapis.com/maps/api/js?v=3&sensor=false" type="text/javascript"></script>
   1:  

   2: <style type="text/css">

   3:   html { height: 100% }

   4:   body { height: 100%; margin: 0px; padding: 0px }

   5:   #map_canvas { height: 100% }

   6:   #textarea {

   7:     position:absolute;

   8:     padding:0px;

   9:     z-index:888;

  10:     bottom:5px;

  11:     right:5px;

  12:     opacity:0.90;

  13:     text-align:center;

  14:     border:0px #ccc solid;

  15:     background-color: #FFF;

  16:     visibility: hidden; 

  17:     }

  18: </style>

  19: <script type="text/javascript"> 

  20: var map;

  21: var points = [];

  22: var lines;

  23: function initialize() {

  24:  

  25:     map = new google.maps.Map(document.getElementById("map"), {

  26:         zoom: 5,

  27:         center: new google.maps.LatLng(30.637905104982618, 71.103515625),

  28:         mapTypeId: google.maps.MapTypeId.ROADMAP,

  29:         

  30:                 });

  31:             }

  32:  

  33: function createMarkers(coordinates){

  34:     lines = coordinates.split("\n");    //splits lines pasted in text box

  35:     alert('There are '+ lines.length +' points to display on map');

  36:     for (var i=0; i<lines.length; i++){

  37:         var xy = lines[i].split("\t");    //splits data in each line based on Tabs. Data copied from excel comes in Tab Delimited format

  38:         var x = xy[0];

  39:         var y = xy[1];    

  40:         var latlng =  new google.maps.LatLng(x,y);

  41:         points.push(latlng);

  42:         var marker = new google.maps.Marker({

  43:                 position: latlng,

  44:                 map:map

  45:         });

  46:         

  47:         var labelingColumn = document.getElementById('labelingColumn').value;

  48:         addInfoWindow(marker, xy[labelingColumn]);    // Third column in each line is passed to addInfoWindow as content for showing in infowindow

  49:       }

  50:       

  51:       zoomTo(points);

  52:   }

  53:   

  54:       function addInfoWindow(marker, content) {

  55:     var infoWindow = new google.maps.InfoWindow({

  56:         content: content

  57:     });

  58:  

  59:     google.maps.event.addListener(marker, 'click', function () {

  60:         infoWindow.open(map, marker);

  61:     });

  62:     }

  63:  

  64:     function zoomTo(points){

  65:     bounds = new google.maps.LatLngBounds();

  66:       for (i = 0; i < points.length; i++) {

  67:       bounds.extend(points[i]);

  68:       }

  69:       map.fitBounds(bounds);

  70:  

  71:     }

  72:     function clearMap(){

  73:         document.getElementById('coordinates').value = "";

  74:         initialize();

  75:         }

  76:     function showCoordinatesMapper(){

  77:         if(document.getElementById('csvToMap').checked){

  78:             document.getElementById('textarea').style.visibility = 'visible';

  79:             }

  80:         else {

  81:             document.getElementById('textarea').style.visibility = 'hidden';

  82:             }

  83:         }

</script>

</head>

<body onload="initialize()">

<!-- side panel div container -->

<div style="position:absolute; width:230px; height: 100%; overflow:auto; float:left; padding-left:10px; padding-right:10px;">

    <h1>Pakistan GIS</h1>

    <h3>Creating Markers (with Infowindows) from coordinates data in text box</h3>

    Show Coordinates Mapper: <input id="csvToMap" type="checkbox" onclick="showCoordinatesMapper();" />

</div>

<div id='textarea'>

  <form action="#" onsubmit="createMarkers(this.coordinates.value); return false">

    <textarea cols="40" rows="15" wrap="off" id="coordinates">Paste your data with coordinates here...</textarea>    

    </br>

    <label>Select Column for Labeling</label>

    <select id="labelingColumn" width = "100px">

          <option value="2">Column 3</option>

          <option value="3">Column 4</option>

          <option value="4">Column 5</option>

          <option value="5">Column 6</option>

      </select>


    <input type="submit" value="Put on Map"/>

    </form>

    <button id="delete-button" onClick="clearMap();">Clear Markers</button>

</div>

<!-- map div container -->

  <div id="map" style="height:100%; margin-left:250px;"></div>

</body>

</html>

Using Google Earth for Creating GIS Data

Google earth works extremely well in creating new vector data in the form of points, lines and polygons that can be used as shapefiles in ArcGIS or any other GIS software for more advanced processing.

The biggest advantage is that we don’t need to procure high resolution images at highest costs. Instead we can use Google Earth images as background to create our vector data. Following is few pictorial examples of doing so:

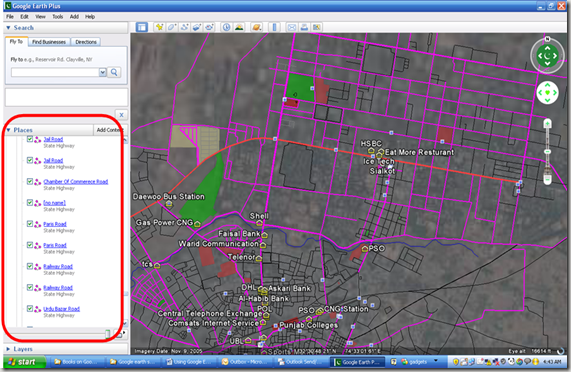
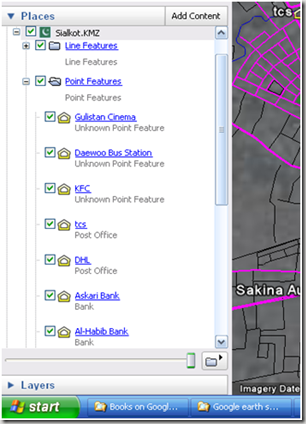
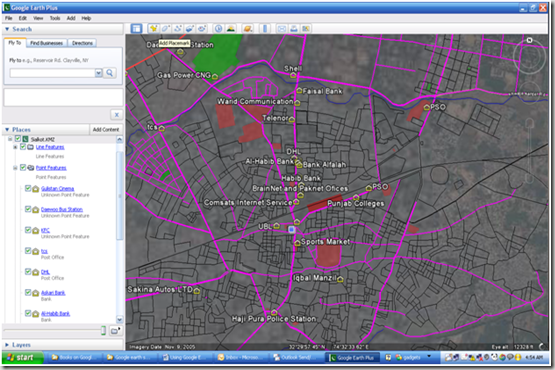
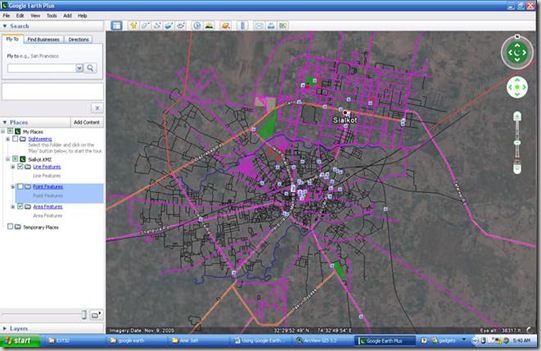
  • Below is an example of vector map of Sialkot created from the available point, line and polygon features of Google Earth. It includes thousands of streets as line features, places of interest as point features and some special areas as polygonal elements. Below we will explain how we have done that and you will find it is pretty simple.

clip_image002[4]


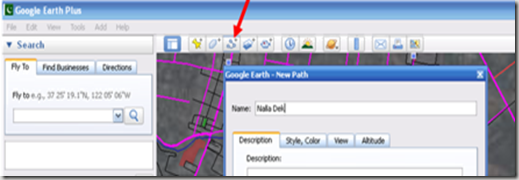
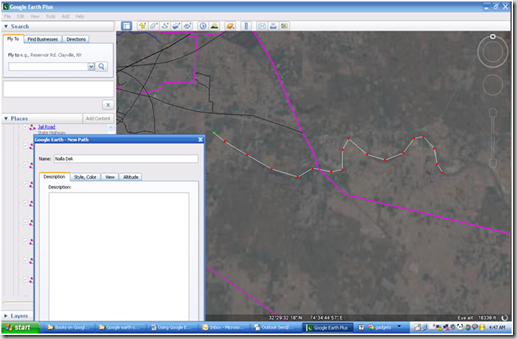
  • To add a new road, street, water body or any other linear feature, Add Path button is used which is available in front toolbar as well as in “ADD” Menue (Short key is Ctrl+Shift+T).

    A new dialog box will open, here you can specify the name of feature and any other description you want. Some other characteristics can also be specified like color, thinkness and style of the feature. Now drag the dialogue on any side without closing and start digitizing on the image as per your need. While adding vertex, you can use the zoom and pan controls of Google Earth, available on the top right of the window. imageimage

Repeat the above process for all the linear features. Each line will be added and can be seen in the left pane under “Places”. image


  • Similar is the case with adding Points and polygons. Below are screen shots:

image


imageimage 

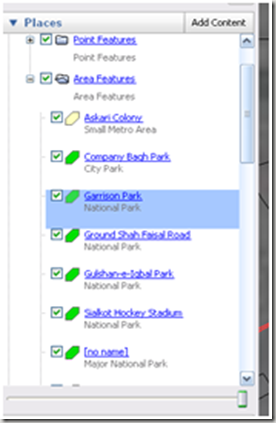
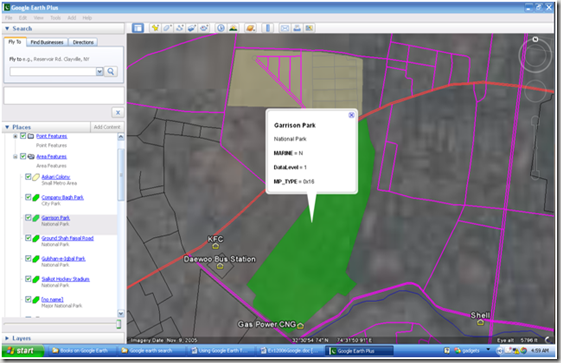
  • Examples of adding polygons includes adding parks, stadiums, graveyards, or even housing schemes as a polygonal features. Below are screen shots of that:

image

imageimage


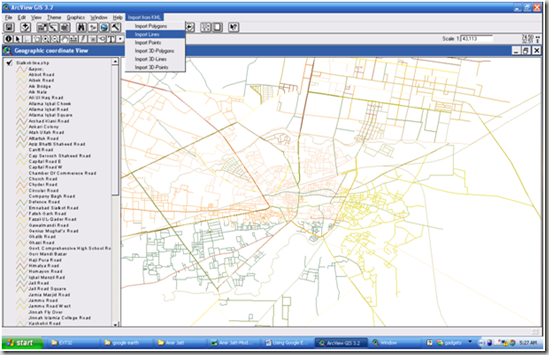
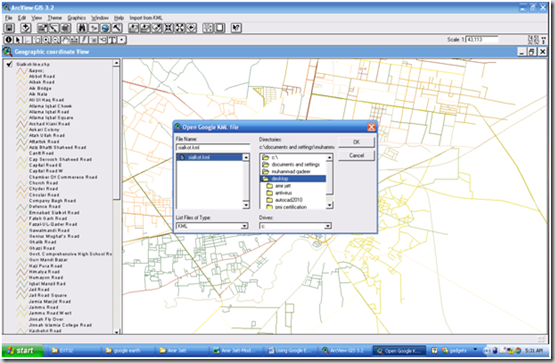
  • Using simple KML to SHAPE convertor tool, the prepared vector data from Google Earth can be used in Arcview / ArcGIS or any other GIS plate form. In the screen shot below, we have used a Shape2KML extension of ArcView 3.2 which let you import lines, polygons or point features from the created kml file.

 image

image

Here is a view of the above digitized area in Google Earth as well as in ArcViewclip_image004


clip_image002[4]


                                       .::Special thanks to Hassan Mughal::.

Hassan Mughal (genius.hassan@gmail.com) has provided the Sialkot map file used in this tutorial in Polish Map Format which was converted in KML and ESRI shape file.

Getting Geo-referenced Images from Google Earth

Google Earth allows for saving images at screen resolution and JPG format. Those are helpful but still need processing and geo-referencing so that they can be used for GIS processing.

The method given below let you get high quality images from Google Earth in geo-referenced form. The principle is to extract images from the local Google Earth cache and then calibrate them for geo-referencing. Two small tools named “GE_jpg_extractor” and “QRST Convertor and Calibrator” will be used in this exercise. You can get them form

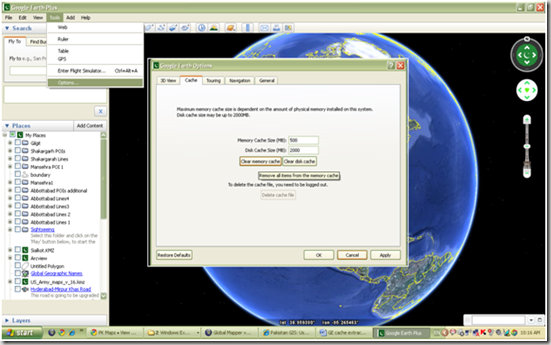
Best way to start is to clear the Google Earth cache folder from the Tools—> Options —->Cache —> Clear Memory Cache of GE software.image

  1. In Google Earth, go to your area of interest. Set a proper zooming level which is required to you and pan to entire of your area with streaming so that it is saved in your local cache again.
  2. Close the program.
  3.  

  4. Click on GE_jpg_extractor.execlip_image002
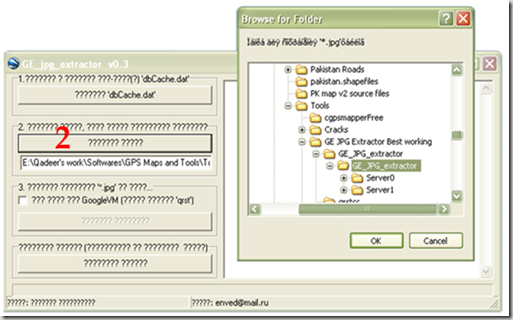
  5. Following window will open to let you specify further options:image
  6. Click on option 1 as shown in the figure below. An “Open” window will appear, select dbChache.dat from the Google Earth Folder. Make sure that Google Earth software is closed otherwise it will give an error message.  image
  7. Click on the Option 2 to specify the path where the data will be saved after extraction from cache.image
  8. Check the box in front of Option 3 and click on the button. The progress bar will start showing the rate of extraction. On its completion images will be extracted in the specified folder.image
  9. You will see in the specified destination folder, there will be one or two new folders named “Server 0” and “Server 1”.
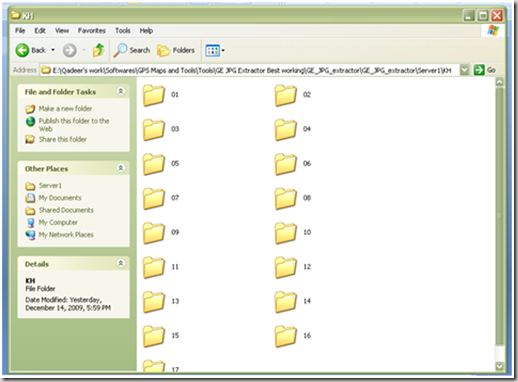
  10. Server 0 folder is of your interest. It will be having another folder named “KH”. That will contain further folders named as 01, 02, 03…..19 or 20. Patches in folder 18 and above are of really good resolution.image
  11. Now run qrstcc.exe clip_image002[6]It will open the calibrator for you.
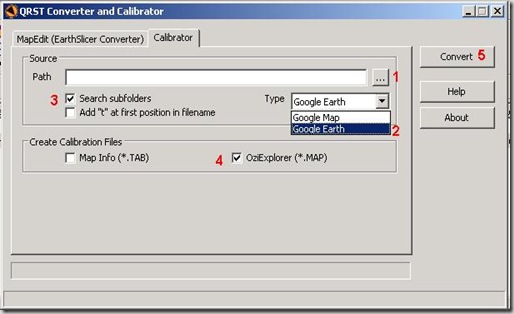
  12. Follow the process as mentioned in the picture below to calibrate your extracted patches. clip_image003
  13. In the Source Path, point the folder in which patches are saved. Generally it will be KH folder in Server 0
  14. Map type should be Google Earth
  15. Check the Search Subfolders option. It allows to create calibration file for all patches in the subfolders in KH, i.e. 01, 02, 03…..20
  16. Calibration file type should be OziExplorer
  17. Hit Convert, and progress will start. At successful completion it will give a message of “Done”.
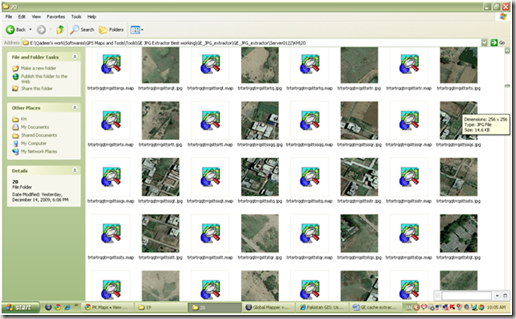
  18. Now open the folders named 17, 18 or above and you will see all patches have a calibration file of OziExplorer with them. image
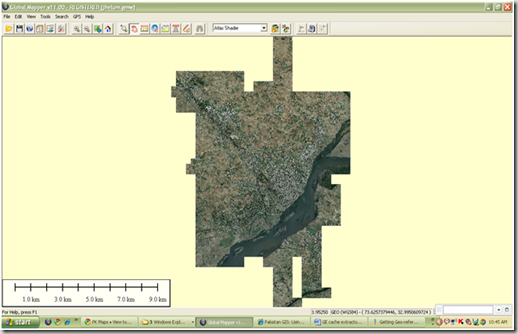
  19. Sort these file by type to get all .map files at one place. Open all files in Global Mapper. Move to the area of your interest and it will be like this.image
  20. Save the image as one file either in geotiff or any other image format you want. It will be georeferenced now can be used for GIS analysis purpose.

                                                       ..::Enjoy::..