About Administrator

--

Using Google Earth for Creating GIS Data

Google earth works extremely well in creating new vector data in the form of points, lines and polygons that can be used as shapefiles in ArcGIS or any other GIS software for more advanced processing.

The biggest advantage is that we don’t need to procure high resolution images at highest costs. Instead we can use Google Earth images as background to create our vector data. Following is few pictorial examples of doing so:

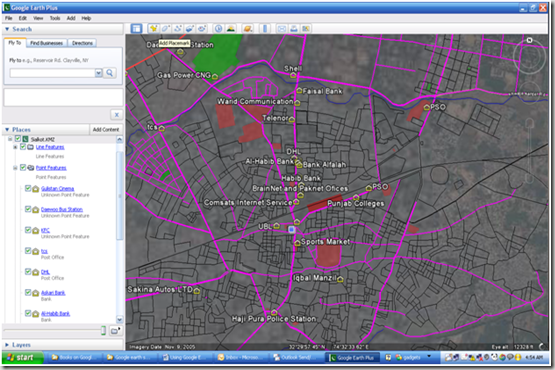
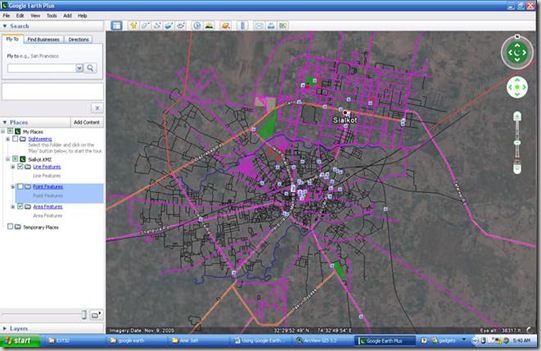
  • Below is an example of vector map of Sialkot created from the available point, line and polygon features of Google Earth. It includes thousands of streets as line features, places of interest as point features and some special areas as polygonal elements. Below we will explain how we have done that and you will find it is pretty simple.

clip_image002[4]


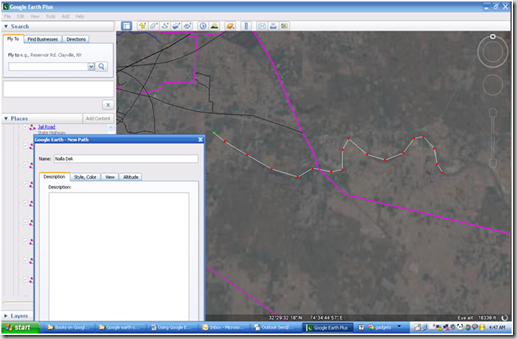
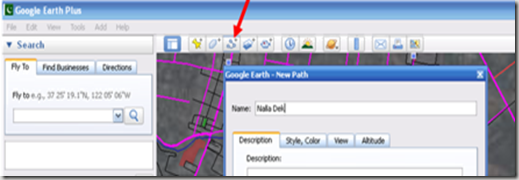
  • To add a new road, street, water body or any other linear feature, Add Path button is used which is available in front toolbar as well as in “ADD” Menue (Short key is Ctrl+Shift+T).

    A new dialog box will open, here you can specify the name of feature and any other description you want. Some other characteristics can also be specified like color, thinkness and style of the feature. Now drag the dialogue on any side without closing and start digitizing on the image as per your need. While adding vertex, you can use the zoom and pan controls of Google Earth, available on the top right of the window. imageimage
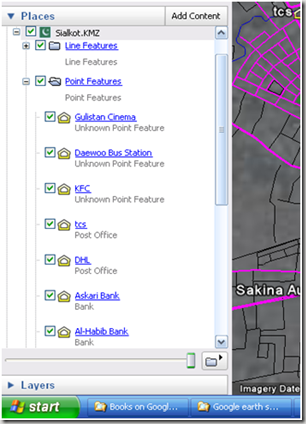
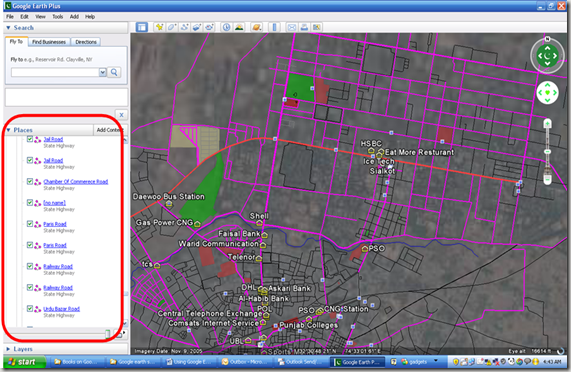
Repeat the above process for all the linear features. Each line will be added and can be seen in the left pane under “Places”. image


  • Similar is the case with adding Points and polygons. Below are screen shots:

image


imageimage 

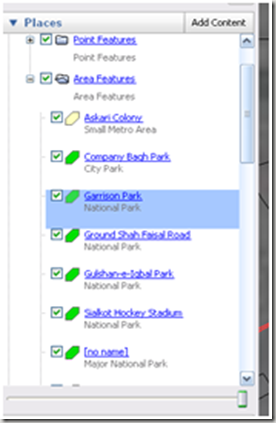
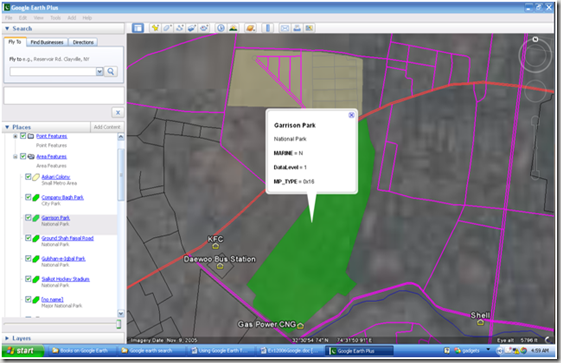
  • Examples of adding polygons includes adding parks, stadiums, graveyards, or even housing schemes as a polygonal features. Below are screen shots of that:

image

imageimage


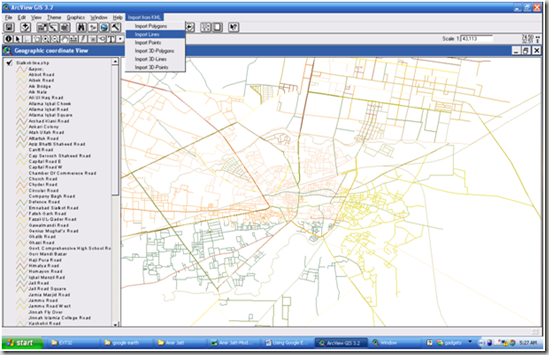
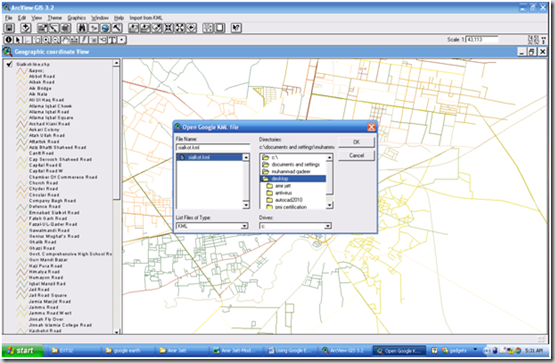
  • Using simple KML to SHAPE convertor tool, the prepared vector data from Google Earth can be used in Arcview / ArcGIS or any other GIS plate form. In the screen shot below, we have used a Shape2KML extension of ArcView 3.2 which let you import lines, polygons or point features from the created kml file.

 image

image

Here is a view of the above digitized area in Google Earth as well as in ArcViewclip_image004


clip_image002[4]


                                       .::Special thanks to Hassan Mughal::.

Hassan Mughal (genius.hassan@gmail.com) has provided the Sialkot map file used in this tutorial in Polish Map Format which was converted in KML and ESRI shape file.

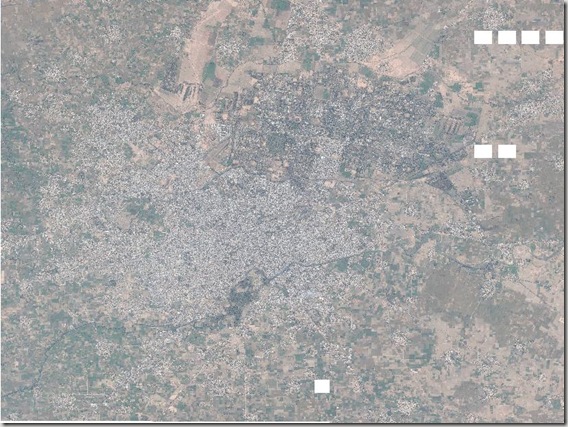
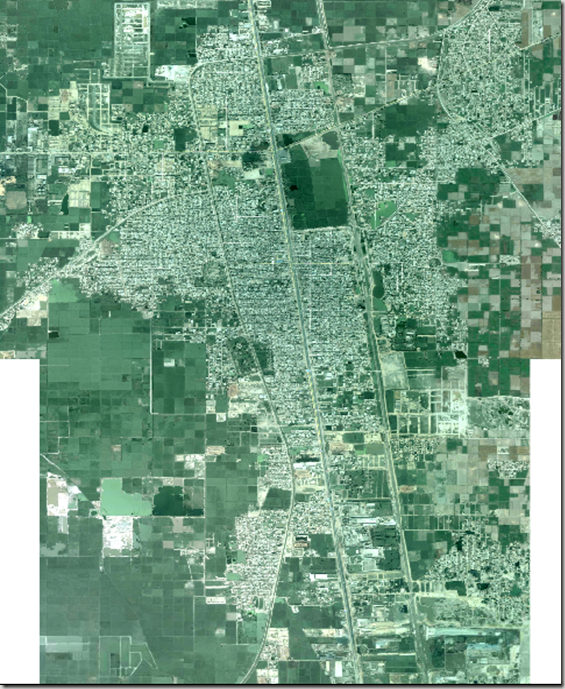
Geo-referenced Satellite Image of Sialkot

Please find here the Geo-referenced Aerial Photograph of Sialkot.

http://rapidshare.com/files/231074969/Sialkot.part1.rar
http://rapidshare.com/files/231086179/Sialkot.part2.rar

You need to download both files Sialkot.part1.rar and Sialkot.part2.rar and then unzip to gather. It will give you JPEG gile of sialkot city area along with .gmw file. The GMW is global mapper workspace file just like ozi explorer. You can use Global Mapper for its conversion to any format as per your need.

Following are the Image Details:

Image Date

9 October 2005

COVERED AREA

196.4 sq km

Download Eye Altitude

533 meters at Google Earth

DESCRIPTION

Sialkot Final.jpg


UPPER LEFT X

74.4745205570

UPPER LEFT Y

32.5547334337

LOWER RIGHT X

74.6323095316

LOWER RIGHT Y

32.4354937786


WEST LONGITUDE

74° 28′ 28.2740″ E

NORTH LATITUDE

32° 33′ 17.0404″ N

EAST LONGITUDE

74° 37′ 56.3143″ E

SOUTH LATITUDE

32° 26′ 7.7776″ N


PROJ_DESC

Geographic (Latitude/Longitude) / WGS84 / arc degrees

PROJ_DATUM

WGS84

PROJ_UNITS

arc degrees

EPSG_CODE

4326

NUM COLUMNS

24595

NUM ROWS

22105

PIXEL WIDTH

0.0000064 arc degrees

PIXEL HEIGHT

0.0000054 arc degrees

sialkot1

Satellite Map of Muredkey

Please find here the high resolution Geo-referenced Aerial Photograph of Muredkey.

http://rapidshare.com/files/271703947/Muredkey_Satellite_Image.rar

Unzip after downloading. Folder will contain two .jpg with their calibration files for Global Mapper. You may adjust the image brightness using Photoshop but without disturbing the canvas size for a brighter image.

Below is the Metadata for the Image:

IMAGE DATE 29 August 2008

COVERED AREA

4623 acres

UPPER LEFT X

74.2348172500

UPPER LEFT Y

31.8199730000

LOWER RIGHT X

74.2726319615

LOWER RIGHT Y

31.7729982323

WEST LONGITUDE

74° 14′ 5.3421″ E

NORTH LATITUDE

31° 49′ 11.9028″ N

EAST LONGITUDE

74° 16′ 21.4751″ E

SOUTH LATITUDE

31° 46′ 22.7936″ N

PROJ_DESC

Geographic (Latitude/Longitude) / WGS84 / arc degrees

PROJ_DATUM

WGS84

PROJ_UNITS

arc degrees

COVERED AREA

4623 acres

NUM COLUMNS

8017

NUM ROWS

9959

NUM_BANDS

3

PIXEL WIDTH

0.0000047 arc degrees

PIXEL HEIGHT

0.0000047 arc degrees

PHOTOMETRIC

RGB Full-Color

BIT_DEPTH

24

ROWS_PER_STRIP

1

COMPRESSION

None

PIXEL_SCALE

( 4.71682e-006, 4.71682e-006, 1 )

MODEL_TYPE

Geographic lat-long system

RASTER_TYPE

Pixel is Area

SOURCE GOOGLE EARTH


image

Satellite Map of Abbottabad City

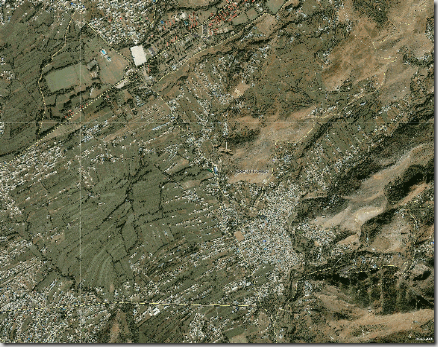
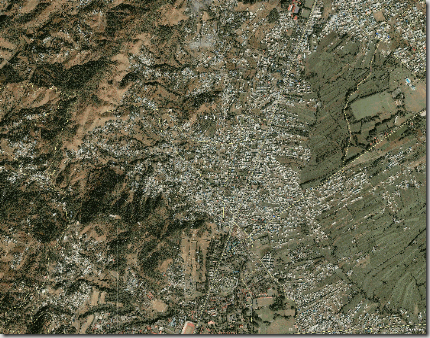
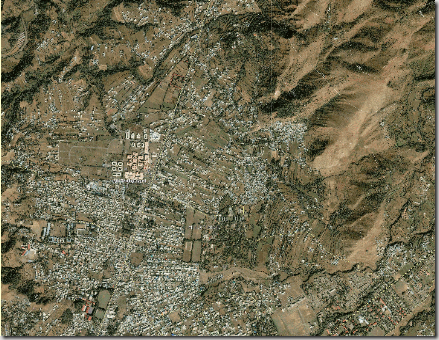
Here we present the satellite map of Abbottabad Urban Area. It is divided in 3 sheets named Eastern City area, Western City Area and Northern/Southern City area. This was initially developed by DLR Centre for Satellite Based Crisis Information and source of data was IKONOS Space Imaging 2005. Image Resolution is 0.6 meter and covers a total area of 23938 Acres. Detailed attributes of each sheet are as below:

FILE NAME

Abbottabad City Eastern Area

UPPER LEFT X

336963.835

UPPER LEFT Y

3784616.320

LOWER RIGHT X

342902.186

LOWER RIGHT Y

3780539.102

WEST LONGITUDE

73° 13′ 50.5269″ E

NORTH LATITUDE

34° 11′ 26.5820″ N

EAST LONGITUDE

73° 17′ 45.0944″ E

SOUTH LATITUDE

34° 09′ 10.9852″ N

PROJ_DESC

UTM Zone 43 / WGS84 / meters

PROJ_DATUM

WGS84

PROJ_UNITS

meters

COVERED AREA

5983 acres

NUM COLUMNS

9352

NUM ROWS

6421

NUM_BANDS

3

PIXEL WIDTH

0.635 meters

PIXEL HEIGHT

0.635 meters

PHOTOMETRIC

RGB Full-Color

BIT_DEPTH

24

ROWS_PER_STRIP

1

COMPRESSION

None

PIXEL_SCALE

( 0.634982, 0.634982, 1 )

TIEPOINTS

( 0.00, 0.00, 0.00 ) –> ( 336963.835, 3784616.320, 0.000 )

MODEL_TYPE

Projection Coordinate System

RASTER_TYPE

Pixel is Area

DOWNLOAD LINK Download
THUMBNAIL Abbottabad City eastern area


FILE NAME

Abbottabad City Western Area

UPPER LEFT X

333518.772

UPPER LEFT Y

3784953.773

LOWER RIGHT X

339461.919

LOWER RIGHT Y

3780874.533

WEST LONGITUDE

73° 11′ 35.7603″ E

NORTH LATITUDE

34° 11′ 35.6452″ N

EAST LONGITUDE

73° 15′ 30.5772″ E

SOUTH LATITUDE

34° 09′ 19.9119″ N

PROJ_DESC

UTM Zone 43 / WGS84 / meters

PROJ_DATUM

WGS84

PROJ_UNITS

meters

COVERED AREA

5991 acres

NUM COLUMNS

9352

NUM ROWS

6419

NUM_BANDS

3

PIXEL WIDTH

0.635 meters

PIXEL HEIGHT

0.635 meters

PHOTOMETRIC

RGB Full-Color

BIT_DEPTH

24

ROWS_PER_STRIP

1

COMPRESSION

None

PIXEL_SCALE

( 0.635495, 0.635495, 1 )

TIEPOINTS

( 0.00, 0.00, 0.00 ) –> ( 333518.772, 3784953.773, 0.000 )

MODEL_TYPE

Projection Coordinate System

RASTER_TYPE

Pixel is Area

DOWNLOAD LINK  Download
THUMBNAIL Abbottabad City western area


FILE NAME

Abbottabad City Northen Area

UPPER LEFT X

335861.470

UPPER LEFT Y

3788217.821

LOWER RIGHT X

341800.488

LOWER RIGHT Y

3784141.415

WEST LONGITUDE

73° 13′ 5.0183″ E

NORTH LATITUDE

34° 13′ 22.8592″ N

EAST LONGITUDE

73° 16′ 59.7212″ E

SOUTH LATITUDE

34° 11′ 7.2634″ N

PROJ_DESC

UTM Zone 43 / WGS84 / meters

PROJ_DATUM

WGS84

PROJ_UNITS

meters

COVERED AREA

5982 acres

NUM COLUMNS

9352

NUM ROWS

6419

NUM_BANDS

3

PIXEL WIDTH

0.635 meters

PIXEL HEIGHT

0.635 meters

PHOTOMETRIC

RGB Full-Color

BIT_DEPTH

24

ROWS_PER_STRIP

1

COMPRESSION

None

PIXEL_SCALE

( 0.635053, 0.635053, 1 )

TIEPOINTS

( 0.00, 0.00, 0.00 ) –> ( 335861.470, 3788217.821, 0.000 )

MODEL_TYPE

Projection Coordinate System

RASTER_TYPE

Pixel is Area

DOWNLOAD LINK  Download
THUMBNAIL Abbottabad City Northen area


DESCRIPTION

Abbottabad City Southern Area

UPPER LEFT X

333045.806

UPPER LEFT Y

3781673.534

LOWER RIGHT X

338985.426

LOWER RIGHT Y

3777597.586

WEST LONGITUDE

73° 11′ 19.5657″ E

NORTH LATITUDE

34° 09′ 48.9301″ N

EAST LONGITUDE

73° 15′ 14.1652″ E

SOUTH LATITUDE

34° 07′ 33.2992″ N

PROJ_DESC

UTM Zone 43 / WGS84 / meters

PROJ_DATUM

WGS84

PROJ_UNITS

meters

COVERED AREA

5982 acres

NUM COLUMNS

9354

NUM ROWS

6419

NUM_BANDS

3

PIXEL WIDTH

0.635 meters

PIXEL HEIGHT

0.635 meters

PHOTOMETRIC

RGB Full-Color

BIT_DEPTH

24

ROWS_PER_STRIP

1

COMPRESSION

None

PIXEL_SCALE

( 0.634982, 0.634982, 1 )

TIEPOINTS

( 0.00, 0.00, 0.00 ) –> ( 333045.806, 3781673.534, 0.000 )

MODEL_TYPE

Projection Coordinate System

RASTER_TYPE

Pixel is Area

DOWNLOAD LINK Same as above in Northern area sheet
THUMBNAIL Abbottabad City Southern area

Getting Geo-referenced Images from Google Earth

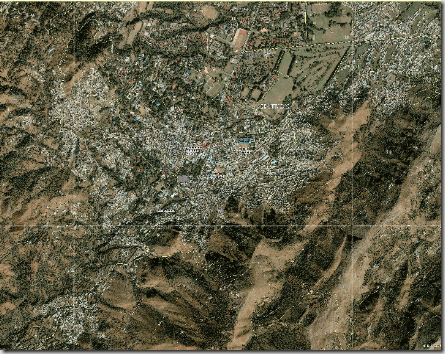
Google Earth allows for saving images at screen resolution and JPG format. Those are helpful but still need processing and geo-referencing so that they can be used for GIS processing.

The method given below let you get high quality images from Google Earth in geo-referenced form. The principle is to extract images from the local Google Earth cache and then calibrate them for geo-referencing. Two small tools named “GE_jpg_extractor” and “QRST Convertor and Calibrator” will be used in this exercise. You can get them form

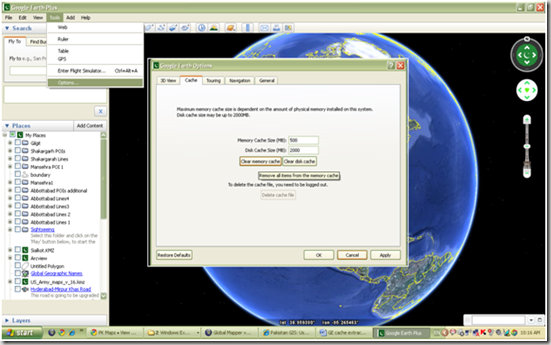
Best way to start is to clear the Google Earth cache folder from the Tools—> Options —->Cache —> Clear Memory Cache of GE software.image

  1. In Google Earth, go to your area of interest. Set a proper zooming level which is required to you and pan to entire of your area with streaming so that it is saved in your local cache again.
  2. Close the program.
  3.  

  4. Click on GE_jpg_extractor.execlip_image002
  5. Following window will open to let you specify further options:image
  6. Click on option 1 as shown in the figure below. An “Open” window will appear, select dbChache.dat from the Google Earth Folder. Make sure that Google Earth software is closed otherwise it will give an error message.  image
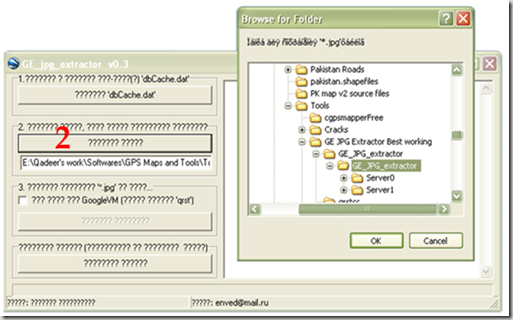
  7. Click on the Option 2 to specify the path where the data will be saved after extraction from cache.image
  8. Check the box in front of Option 3 and click on the button. The progress bar will start showing the rate of extraction. On its completion images will be extracted in the specified folder.image
  9. You will see in the specified destination folder, there will be one or two new folders named “Server 0” and “Server 1”.
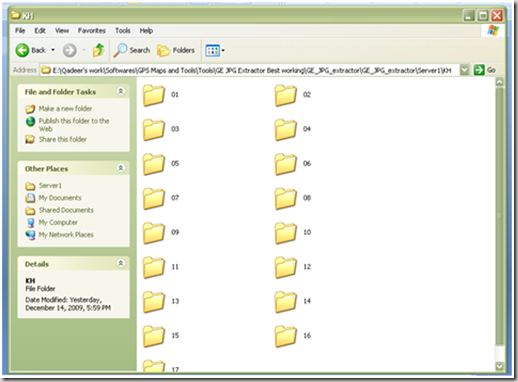
  10. Server 0 folder is of your interest. It will be having another folder named “KH”. That will contain further folders named as 01, 02, 03…..19 or 20. Patches in folder 18 and above are of really good resolution.image
  11. Now run qrstcc.exe clip_image002[6]It will open the calibrator for you.
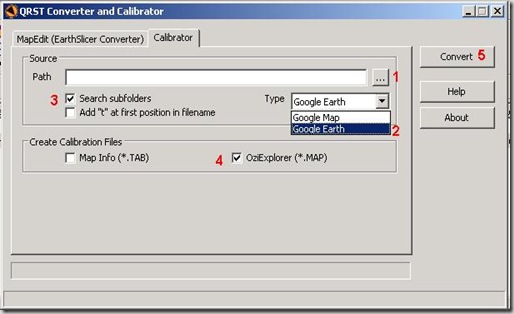
  12. Follow the process as mentioned in the picture below to calibrate your extracted patches. clip_image003
  13. In the Source Path, point the folder in which patches are saved. Generally it will be KH folder in Server 0
  14. Map type should be Google Earth
  15. Check the Search Subfolders option. It allows to create calibration file for all patches in the subfolders in KH, i.e. 01, 02, 03…..20
  16. Calibration file type should be OziExplorer
  17. Hit Convert, and progress will start. At successful completion it will give a message of “Done”.
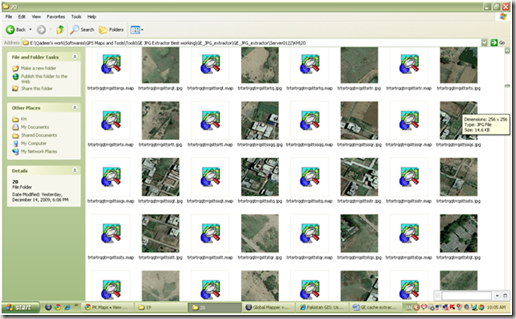
  18. Now open the folders named 17, 18 or above and you will see all patches have a calibration file of OziExplorer with them. image
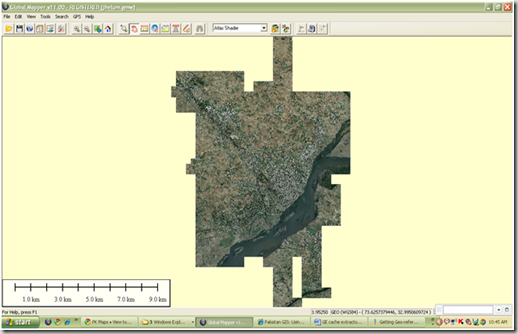
  19. Sort these file by type to get all .map files at one place. Open all files in Global Mapper. Move to the area of your interest and it will be like this.image
  20. Save the image as one file either in geotiff or any other image format you want. It will be georeferenced now can be used for GIS analysis purpose.

                                                       ..::Enjoy::..

Satellite Image Pakistan Flood 18 August 2009

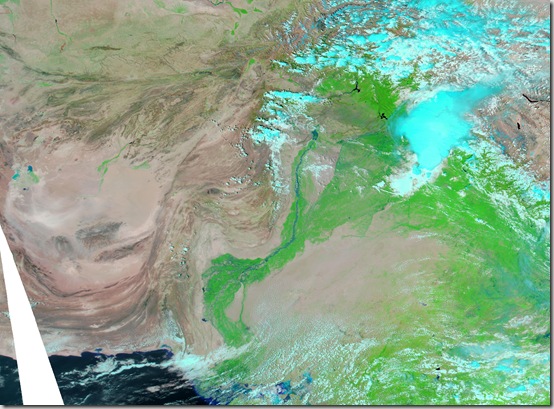
Relying on NASA Earth Observatory on Natural Hazards, following image has been geo-referencing and converted to KML:

  1. 18 August 2009

The Moderate Resolution Imaging Spectroradiometer (MODIS) on NASA’sAqua satellite captured this image of Pakistan. This image uses a combination of infrared and visible light to increase the contrast between water and land. Water appears in varying shades of blue, vegetation is green, and bare ground is pinkish brown. Clouds are bright turquoise.

pakistan_amo_18 Aug 2009

                                  .::Click HERE to request for this data set::.